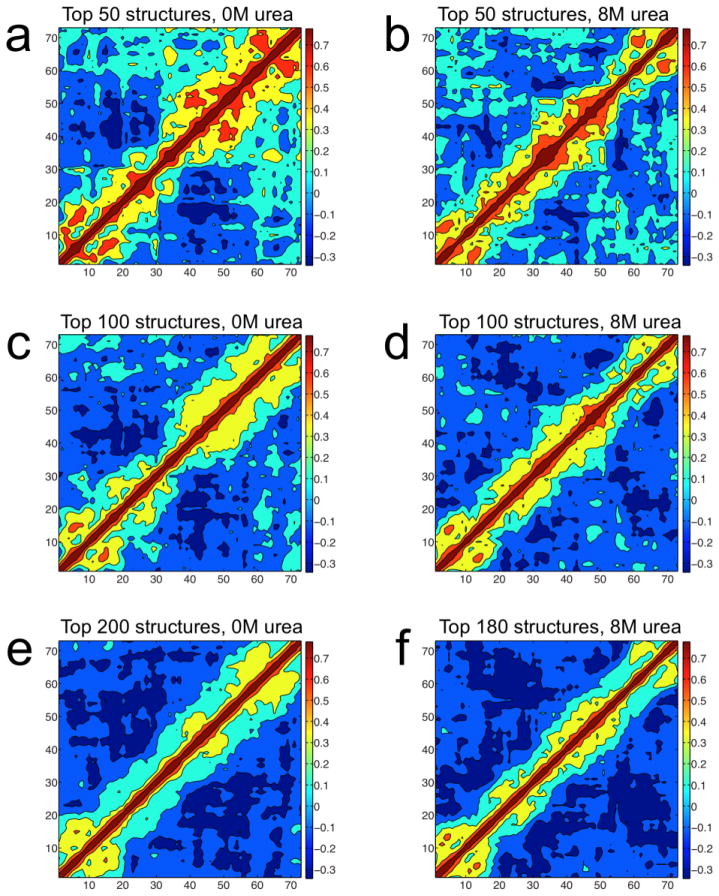
Fig. 5.
Correlation plots for number of neighbors using the top weighted structures from the 0 and 8 M BEGR ensembles. The observed correlations vary from −0.3 (dark blue) to 0.7 (dark red) and a scale bar is shown to the right of each plot. Amino acid position is shown on both axes. Correlation plots for a) 50, c) 100, and e) 200 top weighted structures from a total of 227 structures in the 0 M BEGR ensemble, representing representing 50.0%, 78.5%, and 99.5% of the total weight, respectively. Correlation plots for the b) 50, d) 100, and f) 180 top weighted structures from a total of 189 structures in the 8 M BEGR ensemble, representing 55.4%, 83.2%, and 99.8% of the total weight, respectively.

