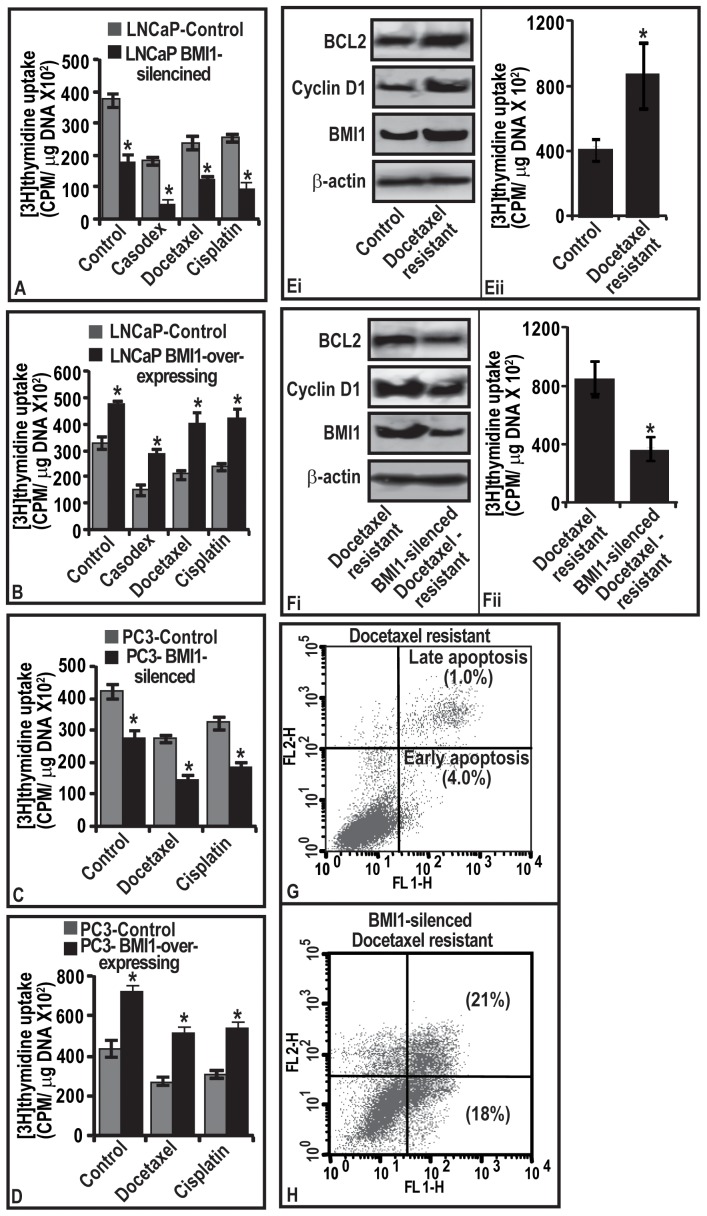
Figure 3. BMI1 confers chemoresistance to tumor cells.
Rate of proliferation and apoptosis in cells were determined by 3[H]thymidine uptake and flow cytometery respectively. (A–D) Histograms represents the rate of proliferation in (A–B) LNCaP and (C–D) PC3 cells harboring varied BMI1 levels and treated with chemotherapeutic agents. Vehicle treated cells served as control. (Ei and Fi) immunoblots represent the levels of BMI1, Cyclin-D1 and BCL2 proteins in docetaxel-resistant, and BMI1-silenced docetaxel-resistant cells. (Eii and Fii) Histograms showing the rate of proliferation in docetaxel-resistant, and BMI1-silenced docetaxel-resistant cells. For immunoblot analyses (Figure Ei and Fi), equal loading of proteins was confirmed by ß-actin. (A–D, Eii and Fii) Each bar represents mean ± SE of three independent experiments, * represents P<0.05. (G–H) represents quantitative estimation of apoptosis in BMI1-silencing chemoresistant cells. The lower right quadrant of the FL1/FL2 plot (Annexin V-FITC) represent early apoptosis and the upper right quadrant (labeled with AnnexinV-FITC and PI) represent late apoptosis.

