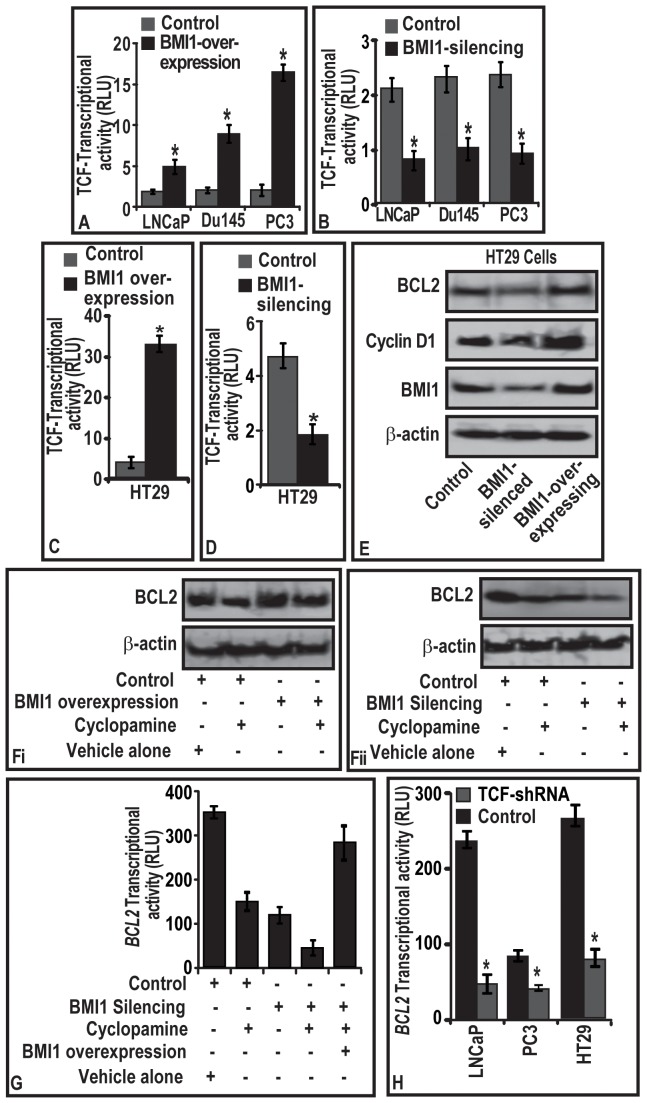
Figure 4. BMI1 regulates BCL2 expression through activation of TCF-transcriptional activity in tumor cells.
(A–B; C–D) Histograms represent the effect of BMI1-overexpression and BM1-silencing on the transcriptional activation of TCF-responsive element in CaP and HT29 cells cells as assessed by luciferase-reporter assays. (E–F) representative immunoblots showing the effect of BMI1-silencing and -overexpression on the levels of BCL2 and Cyclin-D1 proteins in (E) HT29 cells, and (Fi–Fii) CaP cells treated with Cyclopamine (Shh inhibitor) for 12 h. Control cells were treated with DMSO. (G–H) Histogram represents the effect of (G) cyclopamine treatment and (H) TCF silencing on the transcriptional activity of BCL2 promoter in LNCaP, PC3 and HT29 cells. (A–D; G–H), relative luciferase activities were calculated with the values from vector group, and each bar represents mean ± SE of three independent experiments, *represents p<0.05. (E–F) Equal loading of proteins was confirmed by testing immunoblots for ß-actin.

