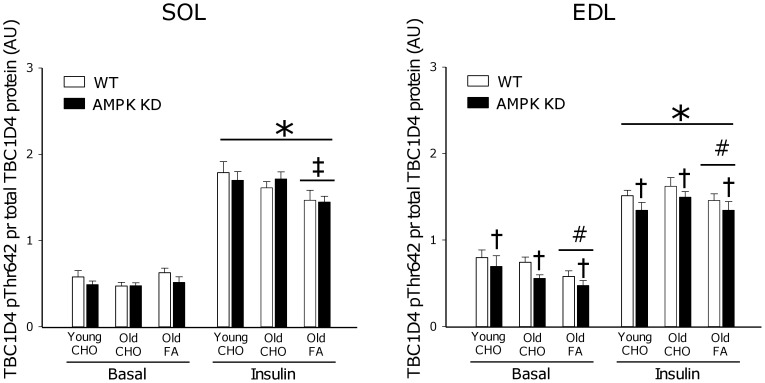
Figure 6. TBC1D4 Thr642 phosphorylation.
Basal (0 µU/ml) and insulin (500 µU/ml) stimulated TBC1D4 Thr642 phosphorylation measured by Western blot analyses in m. Soleus (SOL) and m. Extensor Digitorum Longus (EDL). Measurements were made in young and old AMPK KD mice and WT littermates on chow diet (CHO) or in old mice after 17 weeks of high fat diet (FA). *: Main effect of insulin, p<0.001. †: Main effect of genotype, p<0.05. #: Main effect of diet, p<0.005. ‡: Interaction between diet and insulin action, p<0.001. Values are means ± SE. n = 11–15.

