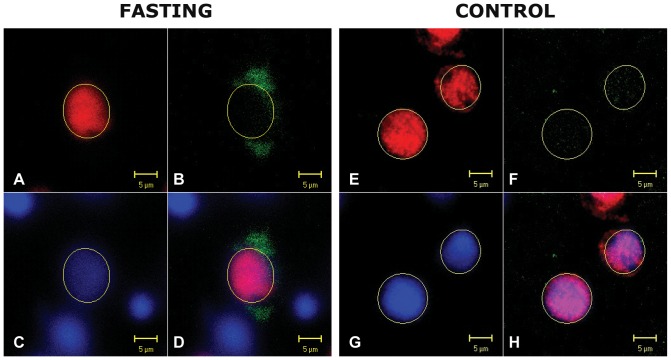
Figure 4. Intracellular Fto localisation in some of the hypothalamic neurons of 48 h-fasted and control rats.
Representative confocal images of sections from control (n = 3) and 48 h fasted (n = 3) rats. Sections were probed for Fto protein (green) and NeuN (red) (4A, 4E). Note that the Fto antibody labeled cell nuclei of both food-deprived (4B) and control animals (4F), but the strongest Fto immunoreactivity was observed in the cytoplasm surrounding neuronal nuclei in LHA, PVN and MVN of the fasted rats (4B, 4D). DAPI was used to stain all nuclei (blue) (4C, 4G).

