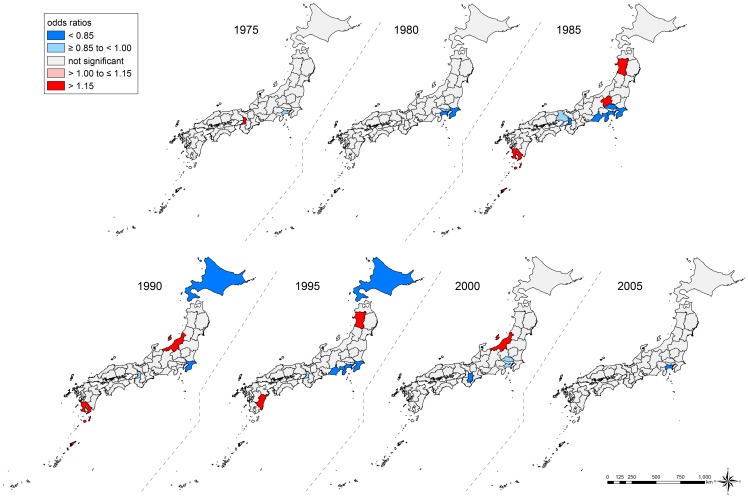
Figure 6. Geographical and temporal variation in suicide among women aged 25–64 years, Japan, 1975–2005.
We show year-specific geographical inequality in suicide mortality across 47 prefectures, conditional on individual age and occupation. Prefecture-level residuals are described by odds ratios with the reference being the grand mean of all prefectures. Prefectures with lower odds for suicide are blue, and those with higher odds are red. The prefectures with non-significant residuals are gray.

