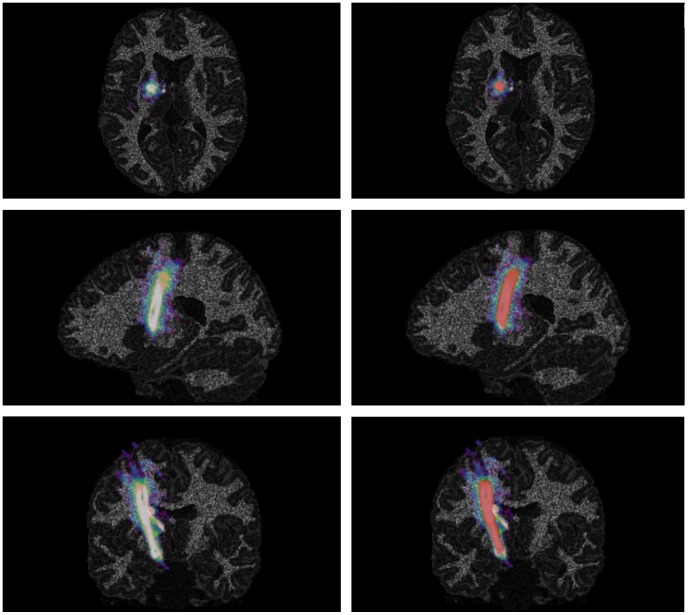
Figure 6. Visualization of results of repeated fiber tracking.
Color-coded results of repeated fiber tracking procedure in sagittal, axial and coronal view with summed up fiber tract reconstructions derived from 128 seed region with light areas showing regions of high consensus between the tracking results (classification according to FBM), additional overlay of modeled corticospinal tract as ground truth in red on the right side.

