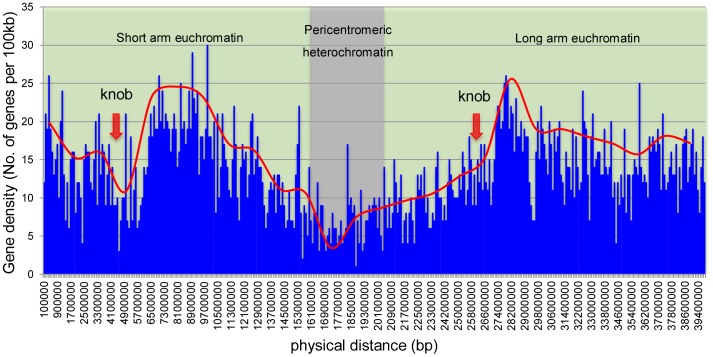
Figure 6. Distribution of gene density along the chromosome 3 of cucumber.
The predicted gene location and number were from the cucumber genome draft published by Huang et al. (2009). They were accessed through Cucumber Genome Database (http://cucumber.genomics.org.cn/page/cucumber/index.jsp). The number of genes per 100 kb was plotted against the physical distance along the chromosome (in base pair). The red line showed the overall trend of gene density. The positions of knobs in the both arms were pointed by red arrows. Three regions, the short arm (green), the long arm (green), and the pericentromeric heterochromatin region (gray) were divided along the chromosome according to the structure of pachytene chromosome and FISH results.

