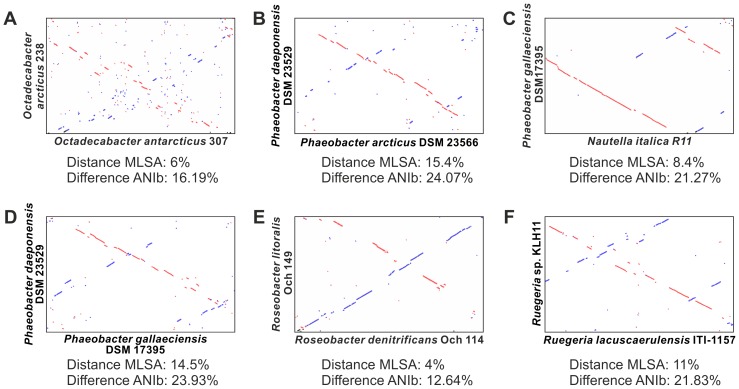
Figure 3. Synteny plots of the genomes of the Octadecabacter strains and other selected Roseobacter clade members.
Synteny plots based on pairwise genome-alignments using MUMmer [33]. Linear regions indicate coherent regions of sequence homology. Homolog regions with identical orientation are displayed in red, inversions in blue. For reference the distance values obtained via multi locus sequence analysis (MLSA, Supplementary Figure S1) and the BLAST-based average nucleotide identities (ANIb) calculated using the JSpecies software [35] are given for each genome pair. Despite their close relationship on MLSA level and ANIb level, the Octadecabacter strains show a low genome synteny and many inversions (A). Other strains show much higher syntenies, despite similar oder more distant relationships on MLSA level and ANIb level (B–F). This includes strains isolated from globally opposite locations (C, D).

