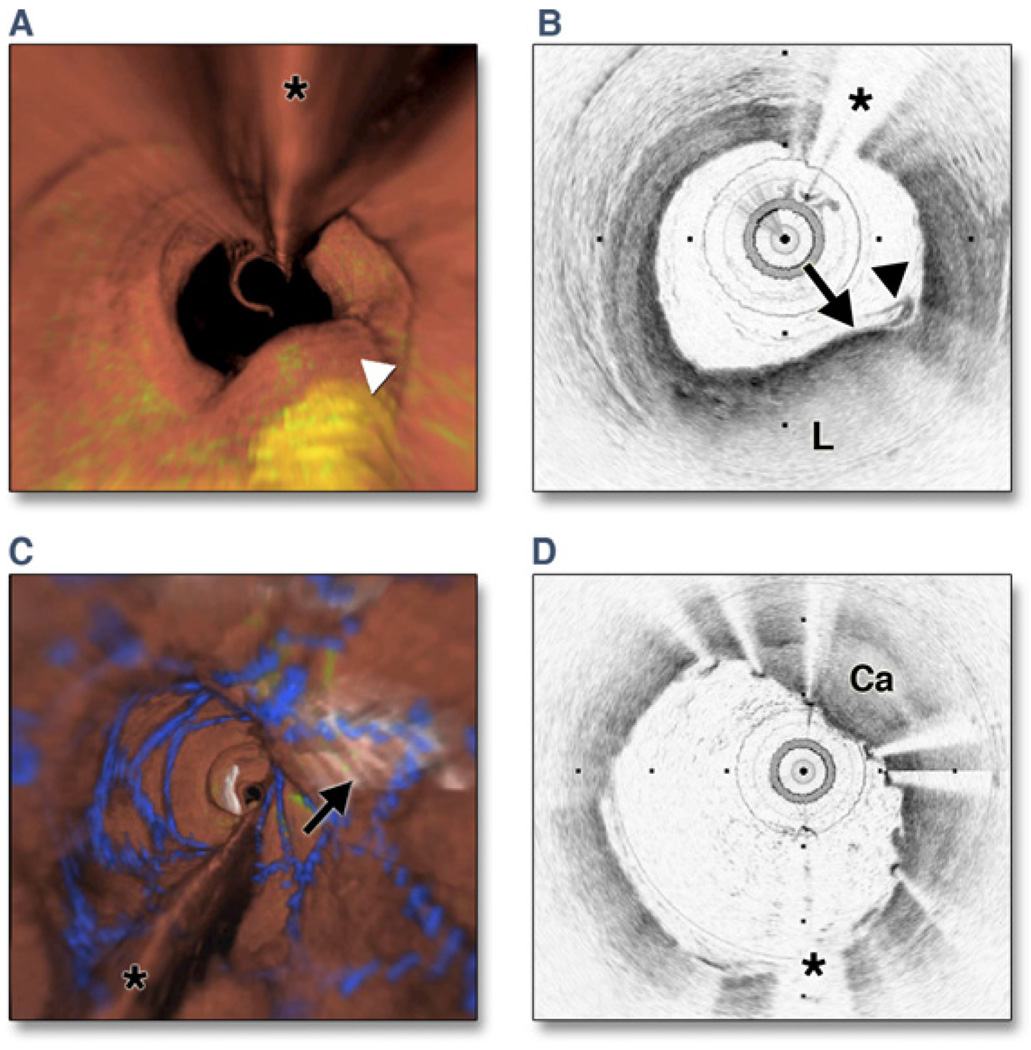
Figure 6. Optical Frequency Domain Imaging of the Left Anterior Descending Coronary Artery, Obtained In Vivo.
(A) Fly-through view (proximal-distal) demonstrates a yellow, elevated lesion with scattered macrophages. (B) Optical frequency domain cross-sectional imaging obtained at the location of the white arrowhead in (A) shows a necrotic lipid core (L). A thin cap is present (black arrow) with a dense band of macrophages at the cap–lipid pool interface. A thin flap of tissue (black arrowhead) can be seen over the cap. Adapted, with permission, from Tearney et al. (30). (C) Fly-through view (proximal-distal), demonstrates a calcified lesion underneath a stent. (D) Optical frequency domain cross-sectional imaging obtained at the location of the black arrow in (C) shows a large calcific nodule (Ca) underneath the stent, from 11 to 5 o’clock. (A and C) Artery wall in red, macrophages in green, lipid pool in yellow, stent in blue. Tick marks, 1 mm. Asterisks denote guidewire artifact.

