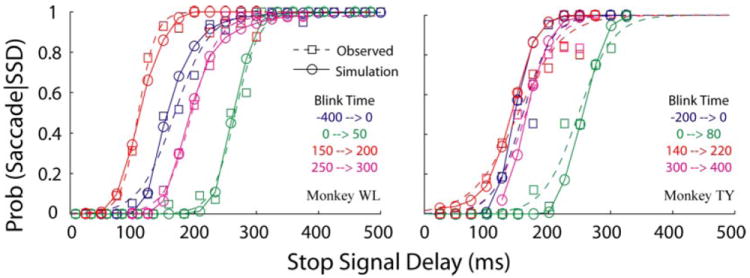
FIG. 14.

Results of Monte Carlo simulations on trials with blinks. Each panel plots 4 computed (“observed”) inhibition functions (dashed line, squares) from performance in countermanding trials. Each inhibition function, shown in a different color, was computed for a limited range of blink times, as indicated in the figure legend. These traces are the same as those plotted in Fig. 6B. The simulated inhibition function for each span of blink times is shown in the same color as circles connected by a solid line. This illustration shows that shifts in the inhibition functions can be simulated despite relatively similar stop rates across different blink times and suggests that blinks mainly modify the motor preparation process.
