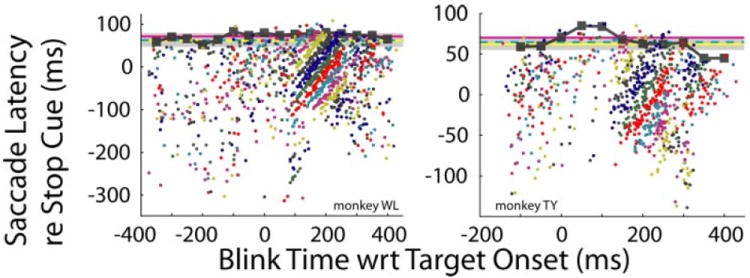
FIG. 8.

Saccade latency relative to the stop cue is plotted as a function of blink time relative to target onset. Filled squares show upper bound values derived from an extreme value distribution fit to data binned in 50-ms increments according to blink time. Changes in color represent changes in SSD, in increments of 25 ms. Horizontal lines show statistical estimates of SSRT (see text) derived from nonblink trials: red, median method; dashed cyan, mean method; yellow line and shaded area, means ± SD of integration method.
