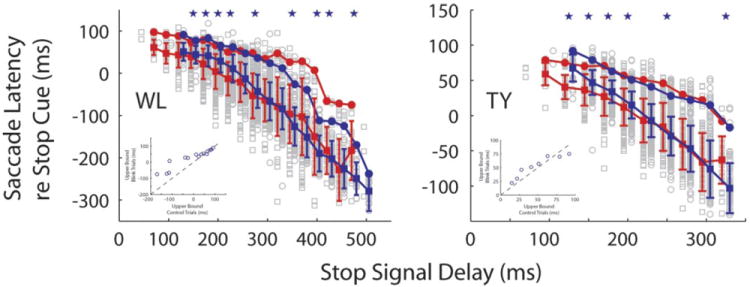
FIG. 9.

Saccade latency plotted as a function of stop cue onset for all blink times. Gray squares and circles are individual data points for countermanding trials with and without blinks, respectively. Red and blue filled squares indicate the medians of trials with and without blinks, respectively. Red and blue filled circles denote the upper bound of trials with and without blinks, respectively. For each SSD, the data have been offset slightly in x axis to facilitate visual comparison. Blue stars denote the SSDs for which the medians were significantly different (Wilcoxon test, P < 0.05). Insets: upper bound values for the two conditions are plotted against each other.
