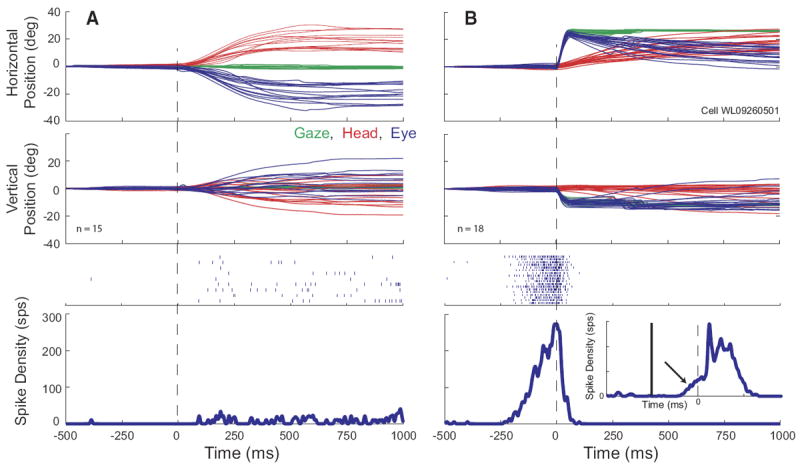
FIG. 11.

Example data for a high-frequency gaze related burst cell. Same format as Fig. 2. On gap trials (B), the cell displays a classic buildup of activity prior to the gaze shift. Bottom inset: averaged spike density function for the same trials, aligned on target onset (gap duration = 200 ms). The x and y scales for the inset are the same as for the outer panel. The offset of the fixation target and the onset of the gaze target are denoted by vertical solid and dashed lines, respectively. The arrow shows buildup activity. On head-only trials (A), the cell discharged at a very low rate, but did not show the robust burst of activity that was characteristic of gaze shifts into its response field.
