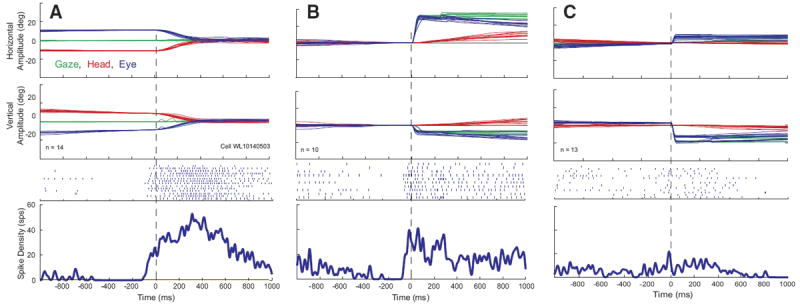
FIG. 2.

Example data for 1 cell that increased its firing rate in association with head movements. Eye, head, and gaze position traces, raster plots, and averaged spike density functions are shown for head-only movements (A), gaze shifts (B), and eye-only movements (C). Data are aligned on movement onset, indicated by the vertical dashed lines. Note that the cell begins to discharge before the onset of the head movement in both A and B. Same color conventions used for Fig. 1.
