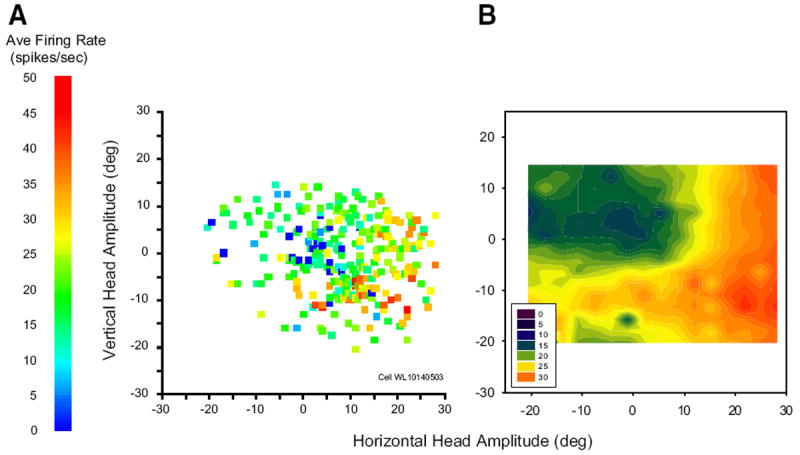
FIG. 6.

Movement field plots for an example head cell. Each data point represents a single movement. A: average firing rate during the movement is plotted as a function of horizontal and vertical head-only amplitude. B: filled contour plot constructed from the raw data points shown in A. For this example cell, vectorial head displacement seems to be predictive of firing rate.
