
Fig. 1.
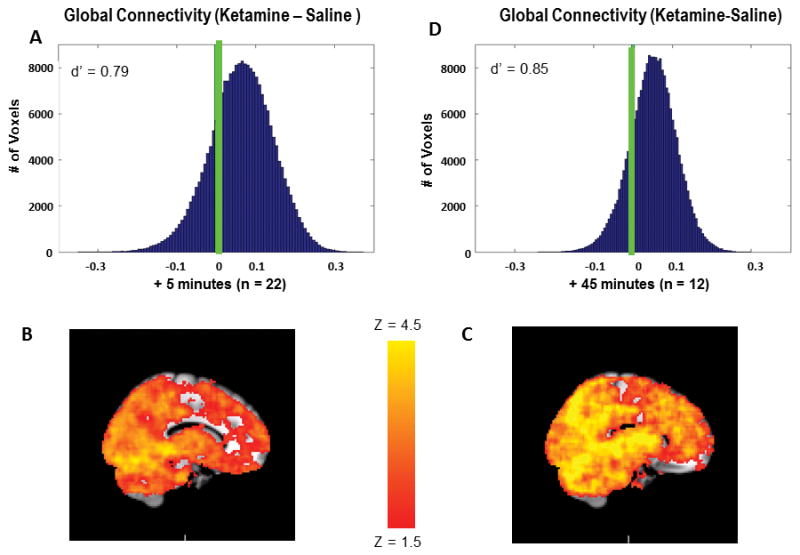
Ketamine increases GBC in the brain. A) Distribution of GBC change scores for all voxels in the group connectivity map (ketamine-saline) immediately after the bolus (primary sample). Green line indicates 0, the predicted mean under the null hypothesis. B) Mean group connectivity map under saline immediately after bolus. C) Mean group connectivity map under ketamine immediately after bolus D) Distribution of GBC change scores for all voxels in the group connectivity map (ketamine-saline) after 45 minutes of continuous ketamine infusion (additional sample). Green line indicates 0, the predicted mean under the null hypothesis.