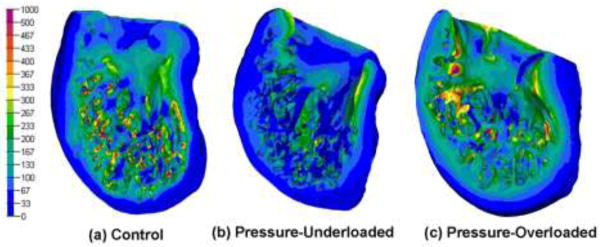
Figure 4.

Color contour plots of calculated von Mises stress for a characteristic model in each of the three groups. Bar scale shows stress in Pa. Scaling is not necessarily equivalent on all models and cutting planes were chosen to show maximal interior view.
