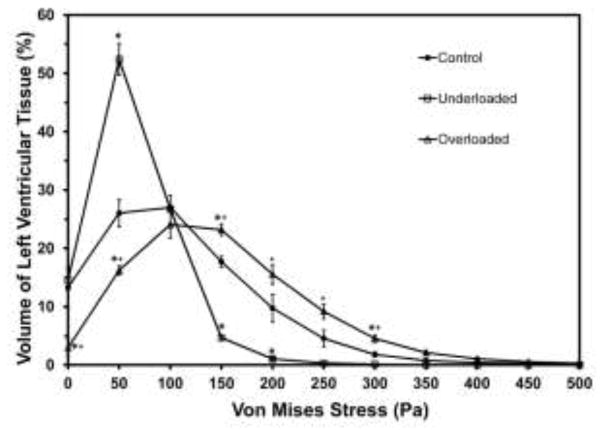
Figure 5.
Histogram of percentage of left ventricular tissue volume versus von Mises stress. For clarity, results are shown as bin height plotted versus the bin center and points are connected. Values are mean ± SE of all models in the group. * denotes percentage volume of the overloaded or underloaded models is significantly different from the control group at the specific stress bin (p<0.05). + denotes percentage volume of overloaded models is significantly different from underloaded models (p<0.05)

