
Fig. 2.
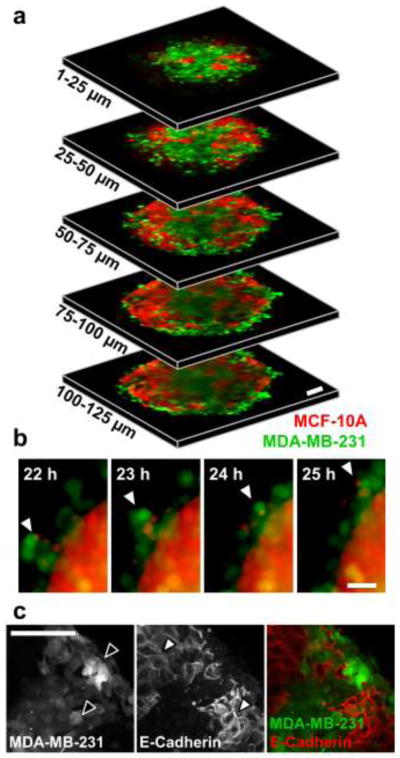
Cell organization within heterotypic co-culture spheroids. (a) Segmented 25-μm thick z-projections (10×) of co-culture tumor spheroid consisting of fluorescently-labeled MCF-10A (red) and MDA-MB-231 (green) cells after 24 h of compaction highlight localization of two cell types through partial thickness of spheroid. (b) Time-lapse imaging at peak spheroid compaction (22–25 h) shows compaction-independent intraspheroid movement of malignant MDA-MB-231 cells. Arrowheads track the movement of a highly-motile cluster of malignant cells that have been excluded to the spheroid periphery. (c) Maximum intensity z-projection of co-culture tumor spheroid consisting of fluorescently-labeled MDA-MB-231 and unlabeled MCF-10A cells. Black arrowheads highlight fluorescently-labeled MDA-MB-231 cells and white arrowheads highlight E-cadherin-positive cell membranes of MCF-10A cells. Scale bars = 50 μm