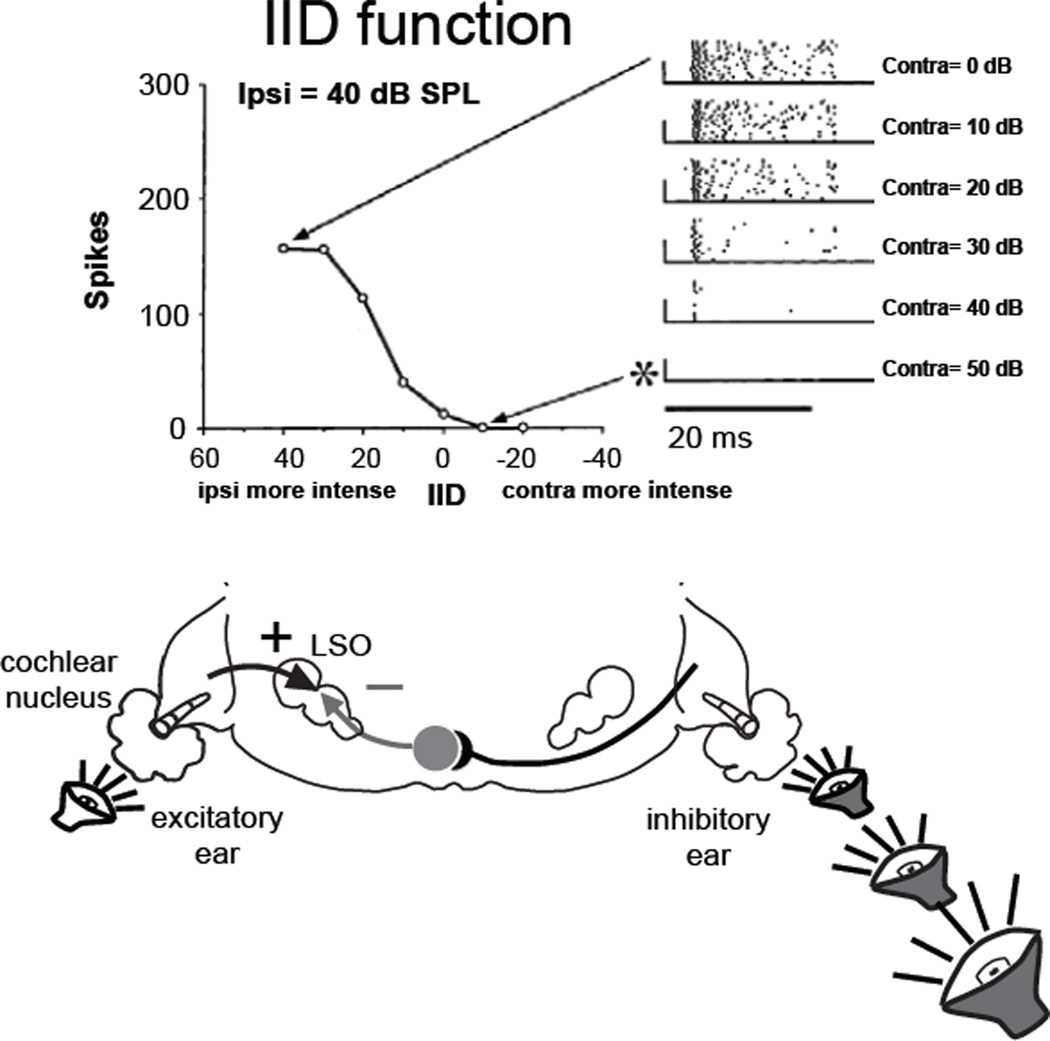
Fig. 1.
IID function of an LSO cell. Discharges evoked by 20 ms tones are shown in the upper right panel. Each successive panel shows the discharge suppression due to increasing intensities at the contralateral (inhibitory) ear. The IID functions plot the spike counts as a function of the IID of the binaural stimulus. Adapted from Park et al., 1997.

