
Figure 1.
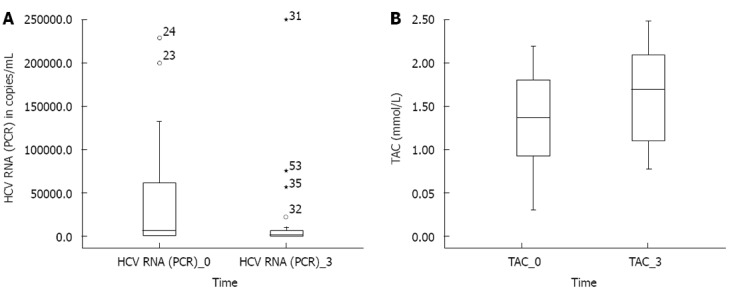
Box plot for hepatitis C virus RNA (polymerase chain reaction) levels (A), total antioxidant capacity (B) before and after treatment. A: Median test (equivalent to Wilcoxon matched pairs test), P < 0.001. Hepatitis C virus (HCV) RNA [(polymerase chain reaction (PCR)]_0: PCR values of patients before treatment; HCV RNA (PCR)_3: PCR values of patients after 3 mo treatment; B: Paired t test, P < 0.001. Total antioxidant capacity (TAC)_0: TAC levels of patients before treatment; TAC_3: TAC levels of patients after 3 mo treatment.