Figure 2.

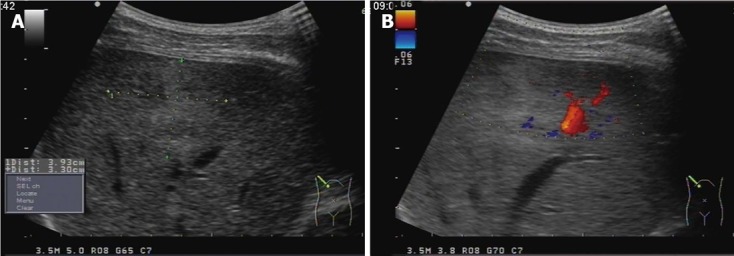
B-mode ultrasonography. A: B-mode ultrasonography showing a 3.9 cm × 3.3 cm mass with inhomogeneous echo in the right hemiliver; B: The boundary was unclear and some blood-flow signal was detected within the mass.

B-mode ultrasonography. A: B-mode ultrasonography showing a 3.9 cm × 3.3 cm mass with inhomogeneous echo in the right hemiliver; B: The boundary was unclear and some blood-flow signal was detected within the mass.