. 2013 May 7;7:28. doi: 10.3389/fnint.2013.00028
Copyright © 2013 Radonovich, Fournier and Hass.
This is an open-access article distributed under the terms of the Creative Commons Attribution License, which permits use, distribution and reproduction in other forums, provided the original authors and source are credited and subject to any copyright notices concerning any third-party graphics etc.
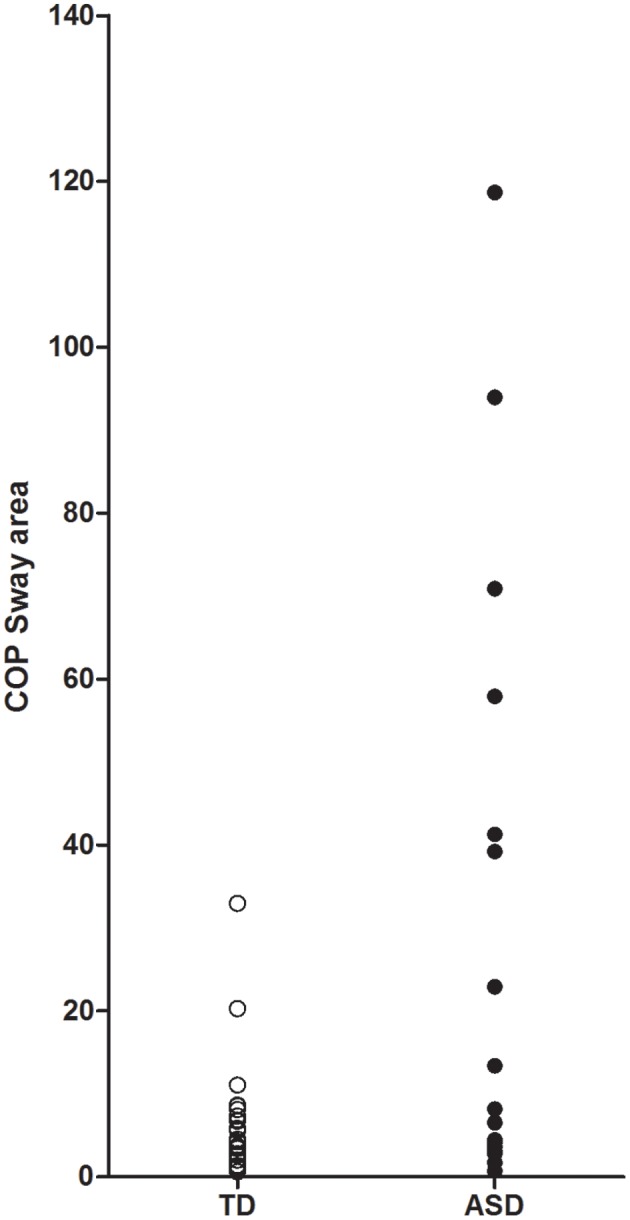
Figure 1.

Scatter plot of center of pressure (COP) sway area.
