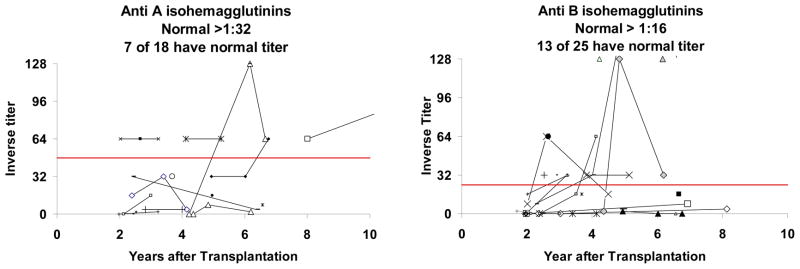
Figure 4.

Production of anti-A and anti-B isohemagglutinins. The left panel includes subjects who are not blood group A and did not receive a blood group A thymus. The right panel includes subjects who are not blood group B and did not receive a blood group B thymus. For inclusion in this figure, subjects had to be tested past 2 years after transplantation. A total of 30 subjects were tested past 2 years after transplantation. Each subject is represented by a separate line or marker. Normal values are those above the solid bold line in each graph.
