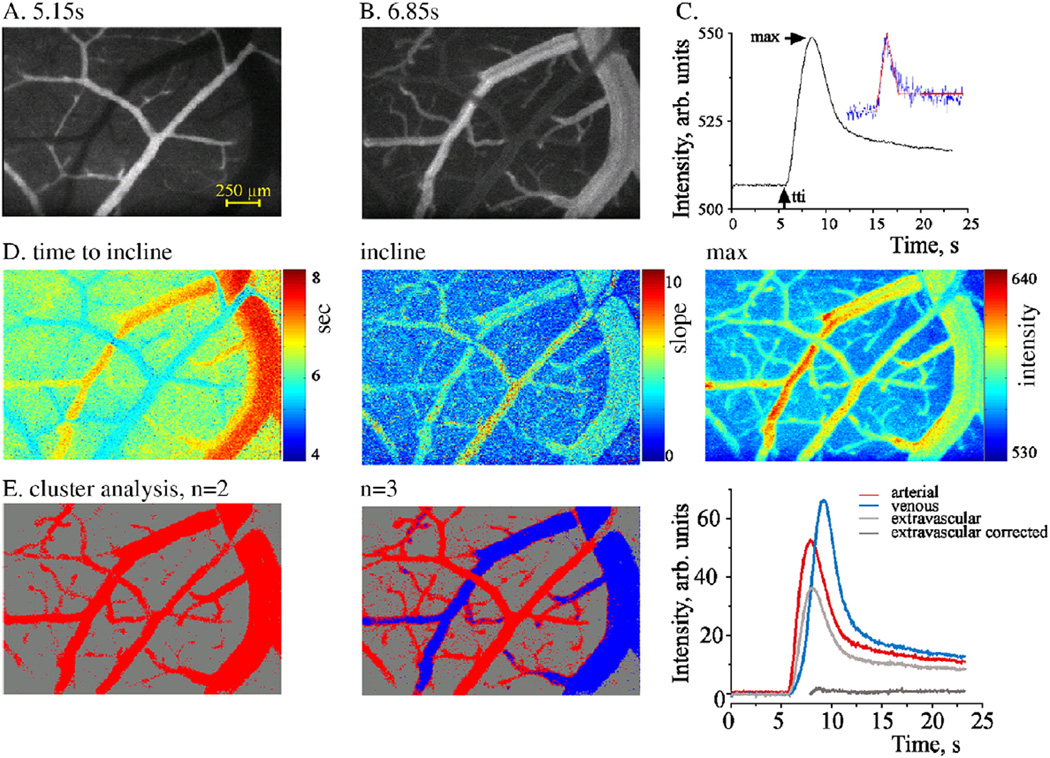
Fig. 1.
Flow visualization in pial vessels and image analysis: (A–C) Intravenous injection of the fluorescent tracer LY under control conditions resulted in an early increase in signal intensity within the surface arterioles (A), followed by delayed labeling of the venules (B). By using image analysis, an intensity–time curve was created (C), reflecting the change in tracer intensity within the local vasculature. The curve allows the estimation of several parameters using a segmented linear model (inset—red line, blue line—the raw data in a representative pixel). (D) Analysis results are represented for each voxel of the original image, enabling the distinction between defined vessels and the extravascular brain tissue. (E) Cluster analysis was used for automatic clustering of similarly behaving pixels (see Methods). Left image is the result of setting the number of clusters to 2; pixels are labeled as red for presumed blood vessels and gray for extravascular tissue. Right image—number of clusters was set to 3, allowing the distinction between arterioles (red), venules (blue) and tissue (gray). Light gray—the original signal in the extravascular compartment, dark gray—corrected signal following “background reduction” (see text).

