Fig. 3.
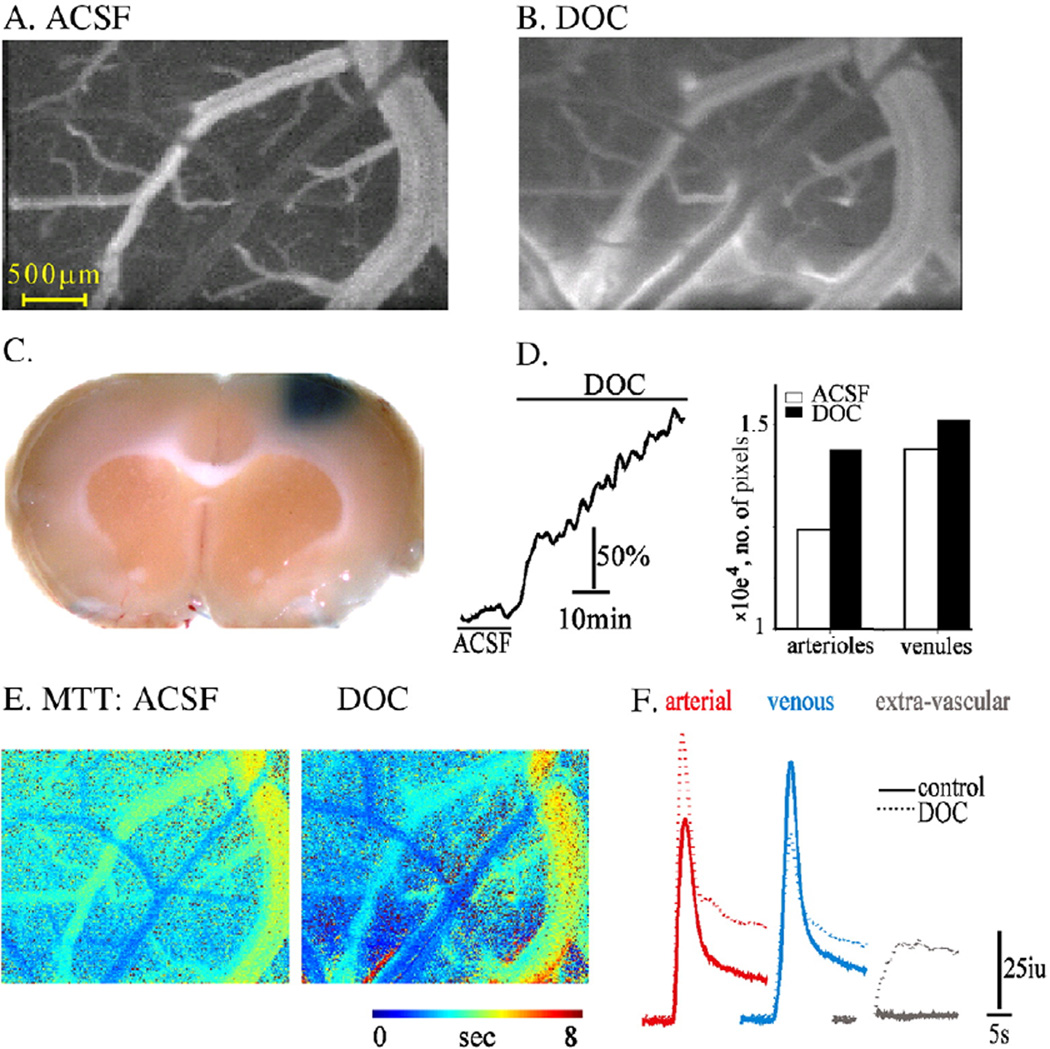
Imaging analysis reveals increased BBB permeability: (A–B) Fluorescent images of surface vessels during the venous phase of injection before (A) and after (B) DOC treatment. Diffusion of the injected tracer (LY) outside the vessels is seen after treatment, indicating BBB breakdown. (C) A coronal section following treatment with DOC and injection of Evans blue demonstrates extravasation of the albumin-binding dye into the treated cortical tissue, which indicates BBB breakdown. (D) Treatment with DOC was associated with a steady increase in LDF signal (left) and vasodilatation. The bar graph shows the number of pixels in the arterial and venous clusters under control conditions (ACSF) and following perfusion with DOC. (E) Maps of mean transient time (MTT) showing decreased MTT in arterioles and the robust increase in the extravascular space where the tracer was accumulating. (F) Intensity curve for each compartment showing the increased flow in the arterial compartment together with decreased signal intensity in the venous compartment after DOC (dashed line). Note the robust slowing of the signal decay in the extravascular compartment after BBB breakdown.

