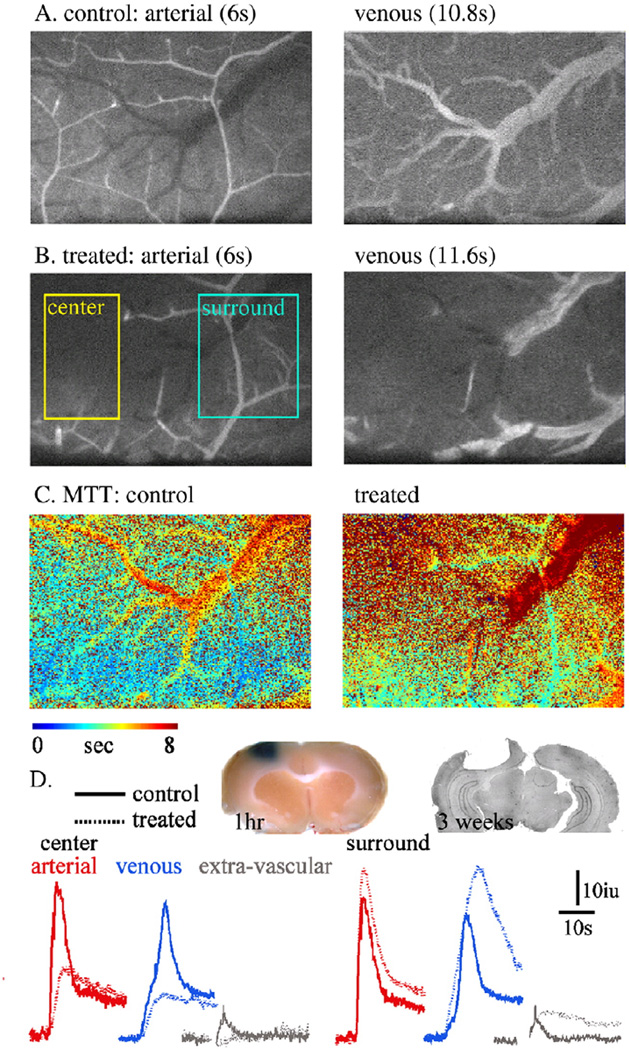
Fig. 4.
Intravascular thrombosis and experimental ischemia: (A, B) Fluorescent images of the arterial (left) and venous (right) phases before (A: control) and 30 min after (B) RBG injection and cortical exposure to light. The thrombotic vessels is observed as an abrupt stop of blood supply (“center”). Note the intact blood supply in the surrounding brain tissue (“surround”). (C) MTT maps before and after the induction of photo-thrombosis, showing the robust reduction in MTT in the ischemic region and the increased MTT in the surrounding (“penumbra”4) region. (D) Intensity curve for each compartment, showing the reduction in the perfusion in the ischemic core. In the surrounding brain a clear increase in signal is noted in the arterial, venous and extravascular compartments, suggesting increased blood flow and BBB breakdown. Inset: left: brain tissue 1 h after RBG treatment (30 min after injection of Evans blue)—confirmed BBB breakdown in the region surrounding the thrombotic vessel. Right: histological brain section (cresyl violet staining) 21 days after a photothrombotic lesion.

