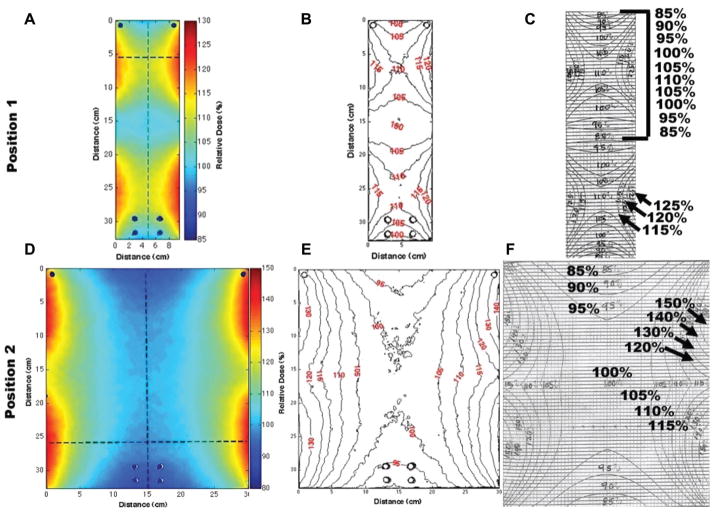
Figure 5.
Left column (A and D): Radiochromic film dose distributions are shown in colour wash for positions 1 and 2 (Figure 2C). Middle column (B and E): Dose distributions were converted to isodose curves. Right column (C and F): Manufacturer’s isodose curves. Comparison of measured and manufacturer’s isodose curve shows good agreement and verifies proper irradiator performance. The vertical axis (y-axis) represents the distance from the floor of the irradiator housing.

