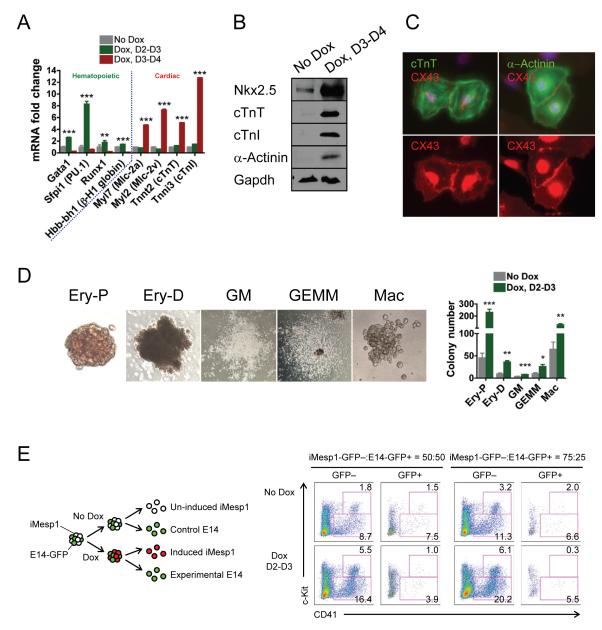
Figure 2. Characterization of differentiated cell types promoted by Mesp1 in early or late mesoderm.
(A) Quantitative RT-PCR for hematopoietic- and cardiac-specific markers for day 6 EBs (n=3). Note that the early pulse (day 2-3) of Mesp1 induction (green bars) upregulated hematopoietic but not cardiac specific markers (versus No Dox, gray bars), whereas the late pulse (day 3-4, red bars) did the opposite.
(B) Immunoblot demonstrating the upregulation of cardiac-specific proteins in day 8 EBs subjected to the late pulse of Mesp1 induction.
(C) Immunostaining for cTnT (green) or α-actinin (green) and CX43 (red) in Mesp1- induced EB-derived cardiac cells.
(D) Hematopoietic colonies induced by Mesp1 (left) and quantification (right, n=3-6). Note that the early pulse of Mesp1 induction increased the numbers of both primitive (Ery-P) and definitive (Ery-D, GM, GEMM, Mac) hematopoietic cell types.
(E) Scheme for determining cell autonomy of Mesp1-induced hematopoiesis (left) and FACS analysis of hematopoietic markers (c-Kit/CD41) in day 6 EBs (right). Note that both c-Kit+ CD41+ progenitors and c-Kit− CD41+ differentiated cells were increased in the GFP− population, but neither was increased in the GFP+ population, suggesting that Mesp1 induction of hematopoiesis is cell autonomous.
Ery-P, primitive erythroid; Ery-D, definitive erythroid; GM, granulocyte-macrophage; GEMM, granulocyte-erythrocyte-megakaryocyte-macrophage; Mac, macrophage
Mean ± SEM is shown in panels A and D. *, p<0.05; **, p<0.01; ***, p<0.001 versus No Dox.
See also Figure S2

