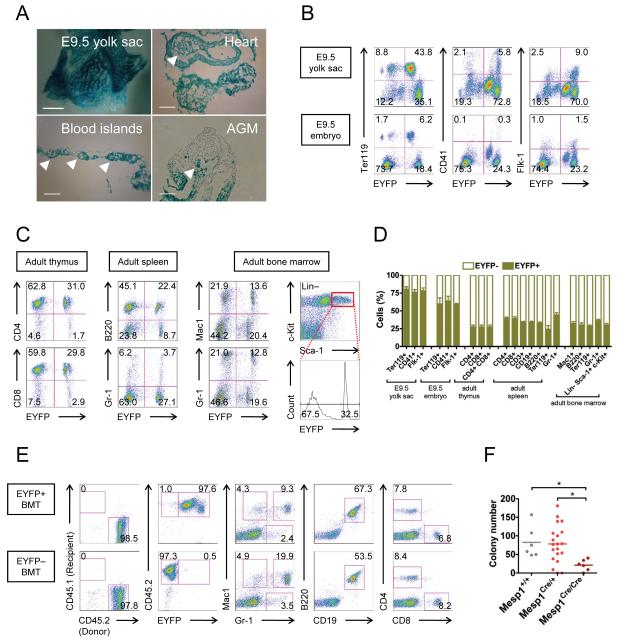
Figure 4. Mesp1 marks progenitors that contribute to both embryonic and adult hematopoiesis.
(A) Whole-mount lacZ staining of Mesp1Cre/+;R26fl-stop-lacZ/+ E9.5 embryos and yolk sacs and sections thereof. Note that lacZ staining was observed in cells of mesodermal origin but not cells in the neural crest and the yolk sac endoderm layer. In particular, lacZ+ blood cells (white arrowheads) were found within the heart chambers, the AGM region and the yolk sac blood islands. Bar = 500 μm (upper left) or 100 μm (others).
(B) FACS profiles of hematopoietic (Ter119, CD41) and endothelial (Flk-1) markers in Mesp1Cre/+;R26fl-stop-EYFP/+ E9.5 yolk sacs (top row) and embryos (bottom row).
(C) FACS profiles of hematopoietic markers in the thymus (far left), the spleen (middle left) and the bone marrow (middle and far right) of adult Mesp1Cre/+;R26REYFP/+ animals.
(D) Quantification of EYFP expression by FACS in hematopoietic fractions of various origins in E9.5 and adult Mesp1Cre/+;R26fl-stop-EYFP/+ animals (n=5-7). Note that all hematopoietic lineages examined contain a significant EYFP+ fraction.
(E) Mesp1-marked bone marrow cells repopulated and contributed to multiple hematopoietic lineages. EYFP+ (top row) and EYFP− (bottom row) total bone marrow cells from adult Mesp1Cre/+;R26fl-stop-EYFP/+ animals were transplanted to NSG-CD45.1/CD45.1 recipient mice. FACS analysis of the peripheral blood 4 months later showed that almost all blood cells derived from the donor (CD45.2+) but not from the host (CD45.1+) (far left). Note that Mesp1-unlabelled transplanted cells remained EYFP− (bottom row, near left), indicating that Mesp1 is not re-expressed in the adult hematopoietic system.
(F) Hematopoietic colony-forming assay showing that yolk sacs of Mesp1Cre/Cre knockout embryos (E8.25-E8.5, equivalent to 6-8 somite pairs) produced fewer hematopoietic colonies than those of Mesp1+/+ and Mesp1Cre/+ embryos. *, p<0.05
AGM, aorta-gonads-mesonephros; BMT, bone marrow transplantation; Lin, lineage cocktail comprising CD3, CD4, CD8, Mac1, B220, Gr-1 and Ter119; HSC, hematopoietic stem cells; NSG-CD45.1/CD45.1, CD45.1/CD45.1 homozygous on the NOD scid gamma background.
Mean ± SEM is shown in panel D.
See also Figure S4

