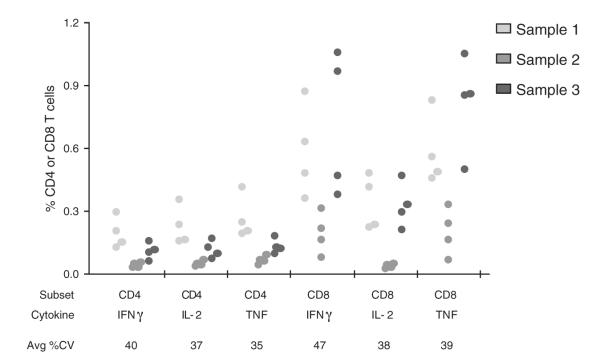
Fig. 3.
Multi-laboratory comparison of the 8-color ICS panel and assay. Four laboratories performed ICS using the same protocol and panel on aliquots of the same 3 samples. Each dot represents the response from an individual laboratory for a given sample, T cell subset, and cytokine. The average CV% for each marginal response is given.

