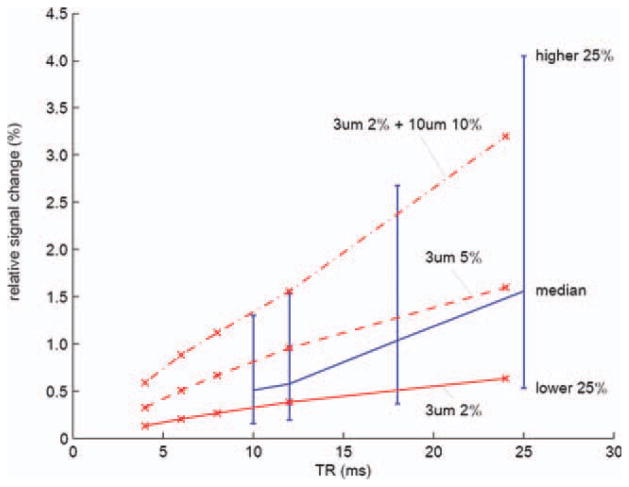
Figure 5.
TR vs. relative signal change from simulation (red) and experiment (blue). Red lines show the estimated relative signal changes of three cases: 2% capillary, 5% capillary, and 2% capillary plus 10% large veins. Blue line shows the experimental results. The relative signal changes from all the activated voxels in all six subjects were considered. The medians of the relative signal changes in the activated voxels were plotted. The upper end of a bar represents the signal change of the voxels that marked upper 25% of the relative signal change. The lower end represents lower 25%.[Color figure can be viewed in the online issue, which is available at wileyonlinelibrary.com.]

