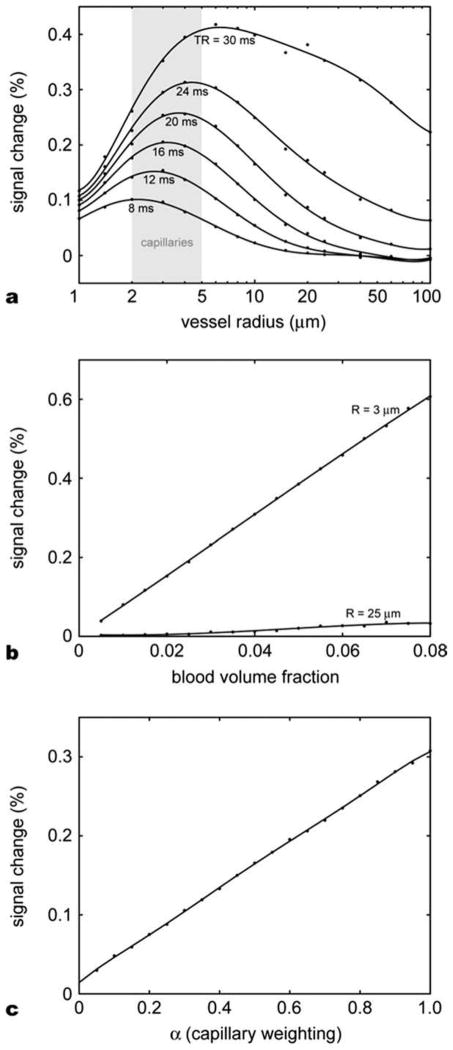
Figure 6.
Monte-Carlo simulation results for extravascular space. (a) Relative signal changes as a function of vessel size for different TRs. The signal change peaks in the capillary size vessels for the TRs commonly used in bSSFP imaging. As the TR increases, the curve shifts to the right and the peak signal change increases. (b) Relative signal changes in the function of blood volume fraction for two different vessel radii, 3 μm (capillary) and 25 μm (venule). In the range of blood volume fraction from 0% to 8% the relative signal change is proportional to the blood volume fraction. (c) Relative signal change as a function of capillary weighting α for a vascular model with two different vessel radii, 3 μm (weighted by α) and 25 μm (weighted by 1 − α). The signal contribution of capillary-sized cylinders dominates the overall signal change.

