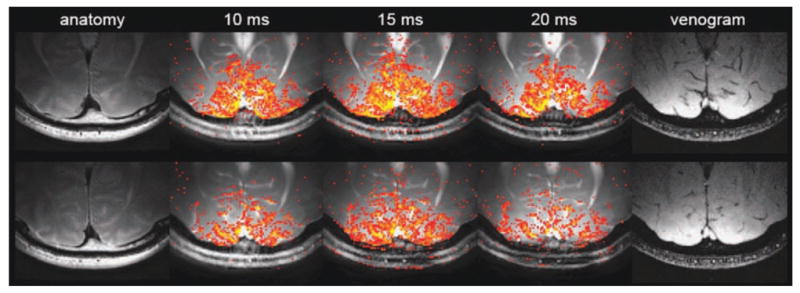
Figure 8.

Two different slices in the high-resolution experiment (top and bottom rows). The pass-band bSSFP fMRI activation maps were overlaid on the averaged data. Three different TRs (10 ms, 15 ms, and 20 ms) were used. [Color figure can be viewed in the online issue, which is available at wileyonlinelibrary.com.]
