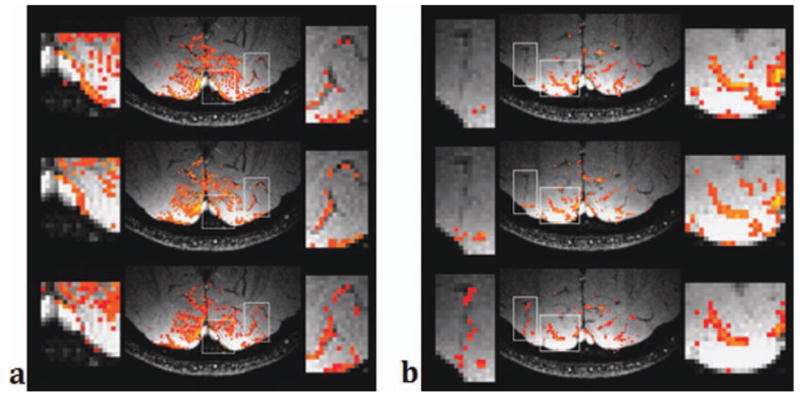
Figure 9.

Activation maps overlaid on venograms for two slices (left and right) and for three TRs (top: TR = 10 ms, middle: TR = 15 ms, bottom: TR = 20 ms). Only 2000 voxels with the highest z-scores were selected and shown in the images. The right box in (a) and the left box in (b) show regions with large veins. A longer TR shows more activated voxels on and near the veins. [Color figure can be viewed in the online issue, which is available at wileyonlinelibrary.com.]
