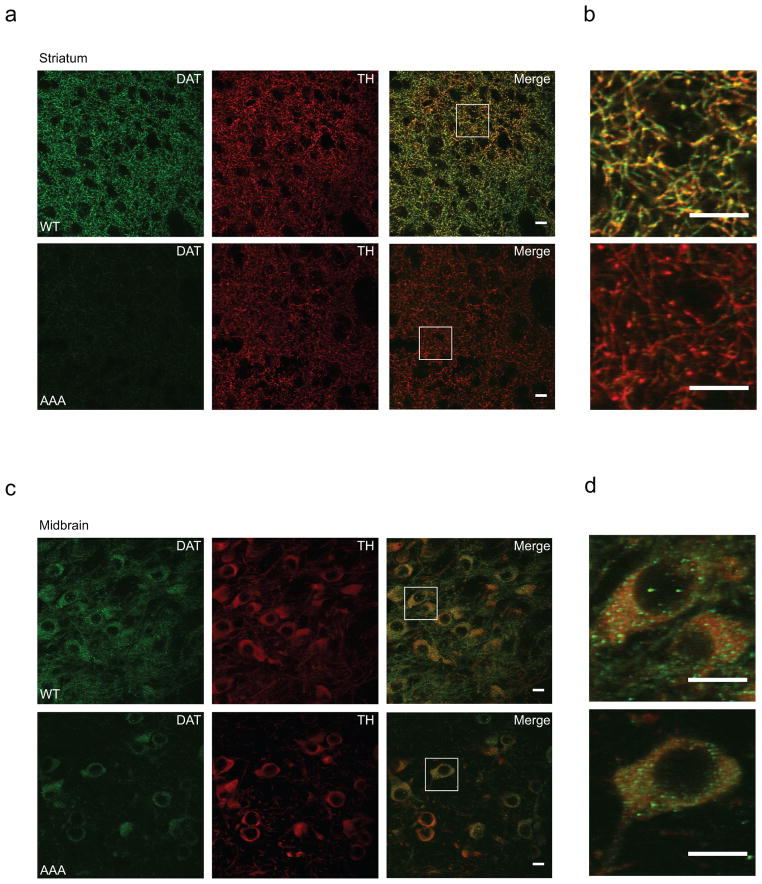
Figure 3. Presynaptic terminals in striatum from DAT-AAA mice demonstrate substantial loss of DAT expression.
(a) Axonal terminals in striatum labelled for DAT (green, Alexa-488) show dense DAT-ir in WT mice, while DAT-AAA mice display almost a complete loss of DAT-ir. Co-localization with TH (red, Alexa-568) demonstrates partial overlay in both WT and DAT-AAA mice. TH distribution demonstrates similar intensities in both genotypes with a typical punctate pattern. (b) Higher magnifications images from WT mice show a typical punctate DAT-labelling of presynaptic terminals in striatum, while scarce distribution is observed in DAT-AAA mice. (c) Neuronal cell bodies in SN from WT mice display intense DAT-ir in both cell soma and extensions, while labelling in DAT-AAA mice is confined mainly to the cell soma region. TH-ir shows prominent labelling of midbrain neurons in both WT and DAT-AAA mice. (d) Higher magnifications images from midbrain of WT and DAT-AAA. All scale bars =10 μm

