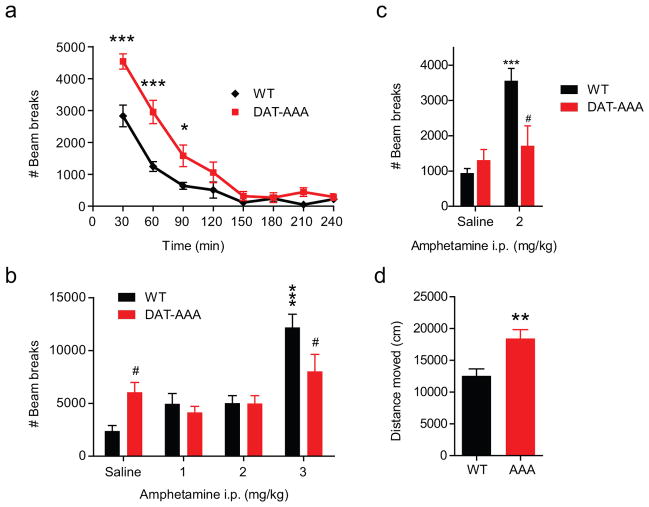
Figure 4. Basal and amphetamine-induced locomotion.
(a) Four hours basal locomotion. Mice were placed in an activity box and locomotion was measured as total beam breaks in 30 minutes bins. Data are means ± s.e.m., * P<0.05, *** P<0.001, Bonferroni post-hoc t-tests after significance in a two-way ANOVA, F(7,175)=7.5; P<0.001; NWT=14, NAAA=13. (b) Amphetamine-induced hyperactivity. Locomotion was evaluated as total beam breaks during one hour. Data are means ± s.e.m., # P<0.05, vs. corresponding WT, Bonferroni post-hoc t-tests after significant two-way ANOVA, F(3,91)=5.58; P<0.01. *** P<0.001 vs. own saline group after significant one-way ANOVA; WT (F(3,26)=23.5; P<0.001); NWT=7–9, NAAA=9–10. (c) Amphetamine-induced hyperactivity after habituation. Locomotor activity is presented as total beam breaks during 2½ hours (means ± s.e.m), # P<0.05 vs. corresponding WT, Bonferroni post-hoc t-tests after significant two-way ANOVA, F(1,27)=11.12; P<0.01. *** P<0.001 vs. own saline group, Student’s t-test vs. WT/saline, t(11)=5.88, NWT=6–7, NAAA=9. (d) Basal locomotion in open-field during 30 min. Mice were placed in the centre of an open field and locomotion was measured as total distance moved. Data are means ± s.e.m., ** P<0.01, t(19)=3.4; NWT=11, NAAA=10.

