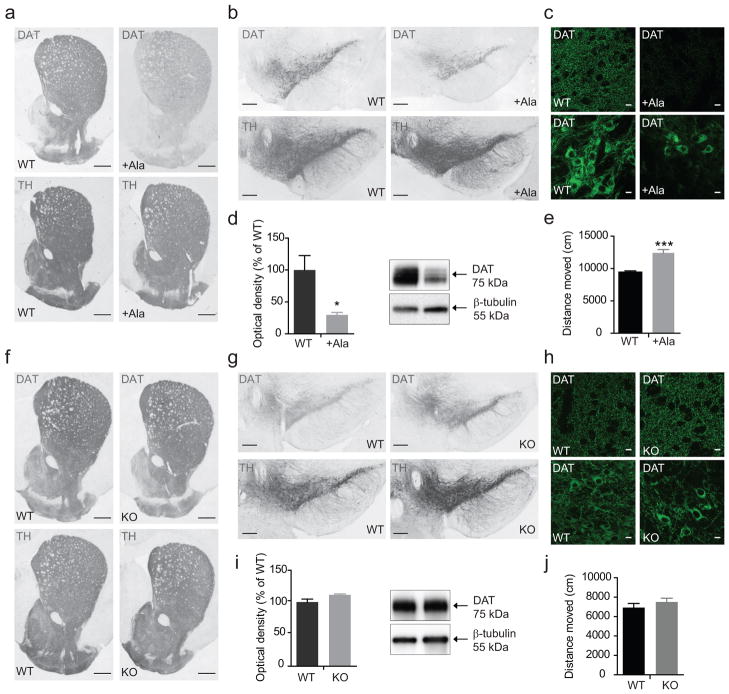
Figure 8. Immunohistochemical and biochemical characterization of DAT+Ala and PICK1 KO mice.
(a, b) Representative photomicrographs of DAT-ir and TH-ir in striatum and midbrain from WT and DAT+Ala mice demonstrate significant loss of DAT-ir in mutant mice, while TH-ir displays similar intensities between both genotypes. (c) Upper panels, confocal micrographs of axon terminals in WT and DAT+Ala striatal slices labelled for DAT. Lower panels, DAT labelling in midbrain slices. Both striatum and midbrain show substantial loss of DAT-ir in DAT+Ala mice. Midbrain neurons in WT show extensive DAT-labelling in both cell bodies and dendrites, while labelling is reduced and limited to perikarya in DAT+Ala mice. (d) Immunoblotting of striatal lysates validates decreased DAT levels in striatum of DAT+Ala. Left panel, densitometric analysis of immunoblots, means ± s.e.m., n=4, * P<0.05, non-parametric Mann-Whitney test. Right panel, representative immunoblots. (e) 30 minutes basal locomotion in the open-field test. Mice were placed in the centre of an open field and locomotion was measured as total distance moved. Data are means ± s.e.m., *** P<0.001, t(19)=5.0; NWT=10, N+Ala=11. (f, g) Representative photomicrographs from PICK1 WT and KO mice show intact DAT- and TH-ir in dopaminergic areas in KO mice. (h) Upper panels, confocal micrographs of axon terminals in striatal slices from WT and PICK1 KO mice, labelled for DAT. Lower panels, DAT labelling in WT and PICK1 KO midbrain slices. Dense DAT-labelling is seen in striatum as well as midbrain of both genotypes. (i) Immunoblotting demonstrates similar striatal DAT levels in both WT and PICK1 KO mice. Left panel, densitometric analysis of immunoblots from WT and PICK1 KO mice, means ± s.e.m, n=4, P>0.05, non-parametric Mann-Whitney test. Right panel, representative immunoblots. (j) 30 minutes basal locomotion in the open-field test. Mice were placed in the centre of an open-field and locomotion was measured as total distance moved. Data are means ± s.e.m., P=0.34, t(44)=1.0; NWT=27, NPICK1 KO=19. Scale bars=10 μm.

