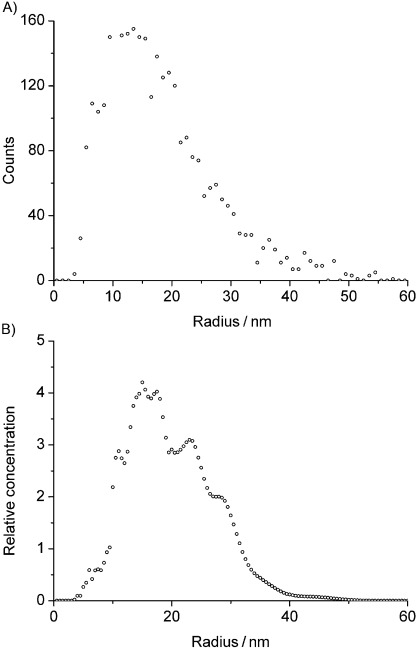
Figure 4.

Size distribution of the Ag NP in KCl/citrate solution, as determined by nanoparticle tracking analysis (NanoSight). A) Number of tracked NPs over their size (calculated from their D values) and B) relative concentration of NPs over their size (output data, fitted automatically by the NTA software); assuming spherically shaped NPs.
