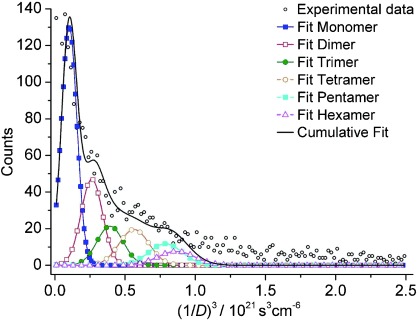
Figure 6.

Experimentally detected distribution of the NP size in KCl/citrate electrolyte, as detected by NTA (○). The data fit (—) is derived by overlying the | individual Gaussians for NP monomers (▪), dimers (□), trimers (•), tetramers (○), pentamers (▪) and hexamers (▵).
