
Fig. 2.
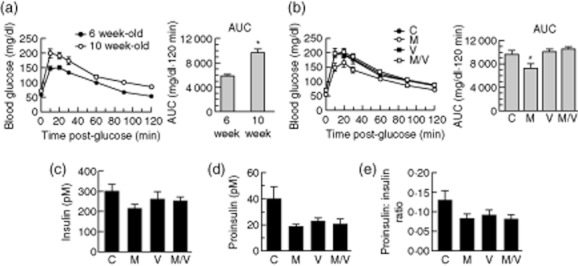
Glucose homeostasis and serum hormone levels after 4 weeks treatment of pre-non-obese diabetic (NOD) mice; 6-week-old prediabetic female NOD mice were randomized to drug treatments for 4 weeks (C = vehicle controls; M = MK-626; V = vorinostat; M/V = MK-626 and vorinostat). (a) Left panel shows results of glucose tolerance tests for 6-week-old mice before randomization (n = 40 mice, closed circles) and in 10-week-old vehicle controls (n = 10 mice, open circles) at the end of the 4-week study period, and the right panel shows area under the curve (AUC) analysis of the glucose tolerance data; (b) left panel shows results of glucose tolerance tests for 10-week-old mice at the end of the study period for each drug, and the right panel shows AUC analysis of the glucose tolerance data (n = 10 mice per group); (c) serum insulin levels in 10-week-old mice at the end of the study period (n = 6–10 mice per group); (d) serum proinsulin levels in 10-week-old mice at end of the study period (n = 6–10 mice per group); (e) serum proinsulin : insulin ratio in 10-week-old mice at the end of the study period (n = 6–10 mice per group). *P < 0·05 compared to either 6-week-old mice (a) or vehicle controls (c).