
Fig. 4.
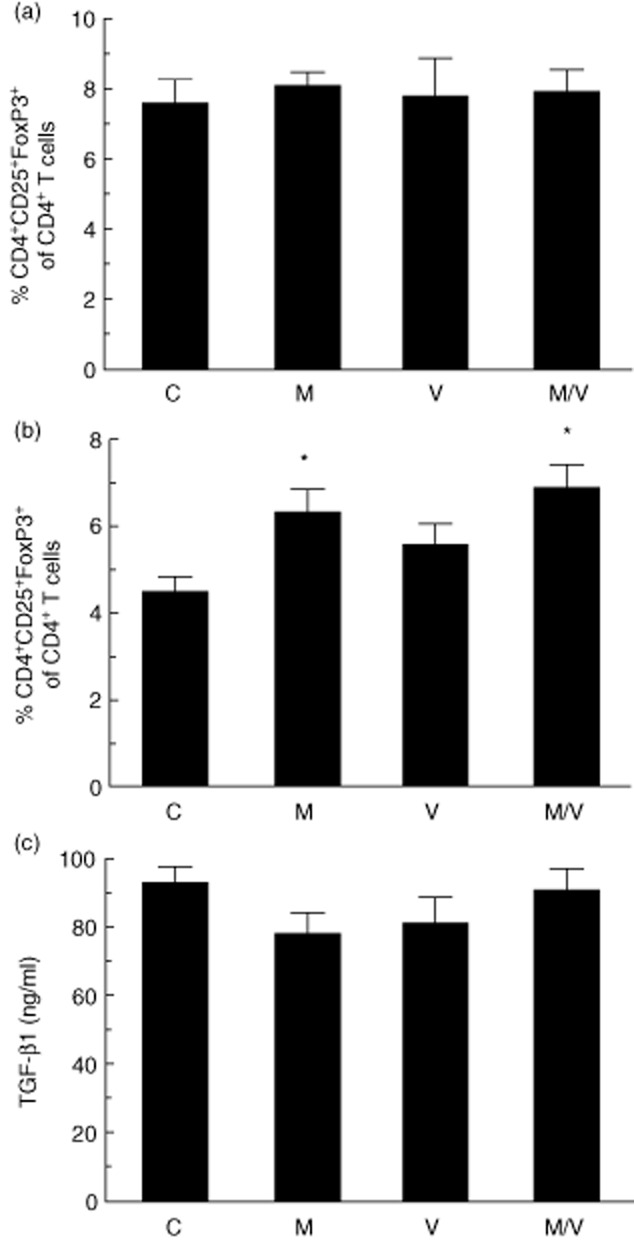
Regulatory T cell populations and transforming growth factor (TGF)-β1 levels in treated pre-non-obese diabetic (NOD) mice. (a) Percentage of CD4+CD25+forkhead box protein 3 (Foxp3+) cells among total CD4+ lymphocytes in splenocytes after 4 weeks' treatment of prediabetic NOD mice with indicated drugs (C = vehicle controls; M = MK-626; V = vorinostat; M/V = MK-626 and vorinostat); (b) percentage of CD4+CD25+FoxP3+ cells among total CD4+ lymphocytes in pancreatic lymph nodes after 4 weeks' treatment of prediabetic NOD mice with indicated drugs; (c) plasma TGF-β1 levels after 4 weeks' treatment of prediabetic NOD mice with indicated drugs. *P < 0·05 compared to vehicle controls.