Fig. 3.

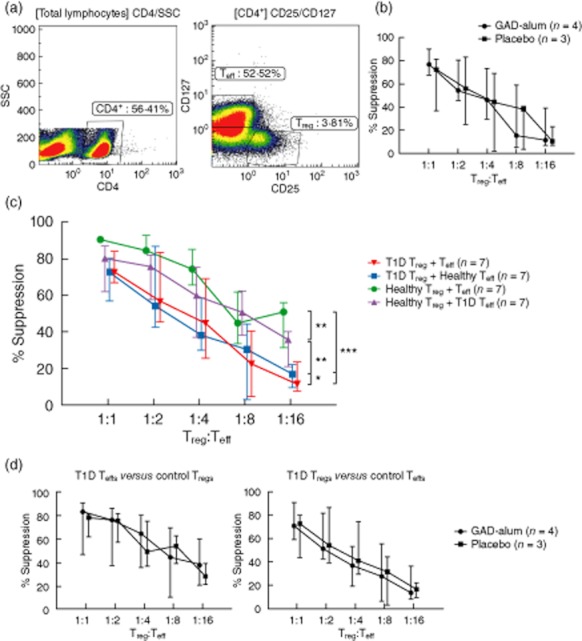
Dose-dependent regulatory T cell (Treg)-mediated suppression of effector T cells (Teff). Proliferation was assessed by [3H]-thymidine incorporation. Percentage of suppression of proliferation in co-cultures of Tregs and Teffs was calculated by dividing the mean counts per minute (cpm) of co-culture wells by the mean cpm obtained from Teffs cultured alone. (a) Left panel illustrates the gate discriminating CD4+ cells and the right panel shows the gates for sorting CD25hiCD127lo (Tregs) and CD25–CD127+/hi cells (Teffs). (b) Suppression exerted by Tregs from patients treated with placebo (n = 3, square) and glutamic acid decarboxylase (GAD)-alum (n = 4, circle) is shown as median for each group. (c) Suppression exerted by Tregs from type 1 diabetes (T1D) patients on autologous Teffs (red downward triangle; n = 7), by healthy Tregs on autologous Teffs (green circle), by T1D Tregs in co-culture with healthy Teffs (blue square) and by healthy Tregs in co-culture with T1D Teffs (purple upward triangle). The suppression is shown as percentage of decrease in Teff proliferation in the presence of Tregs compared to Teffs cultured in the absence of Tregs. Healthy represents repeated measurements (n = 7) of one healthy reference. (d) Left panel illustrates suppression exerted by healthy Tregs in cross-culture with patient Teffs and the right panel shows suppression exerted by patient Tregs in cross-culture with healthy Teffs. Statistical significances are shown as P-values: *P < 0·05; **P < 0·01; ***P < 0·001. Data points indicate medians, error bars designate interquartile range.
