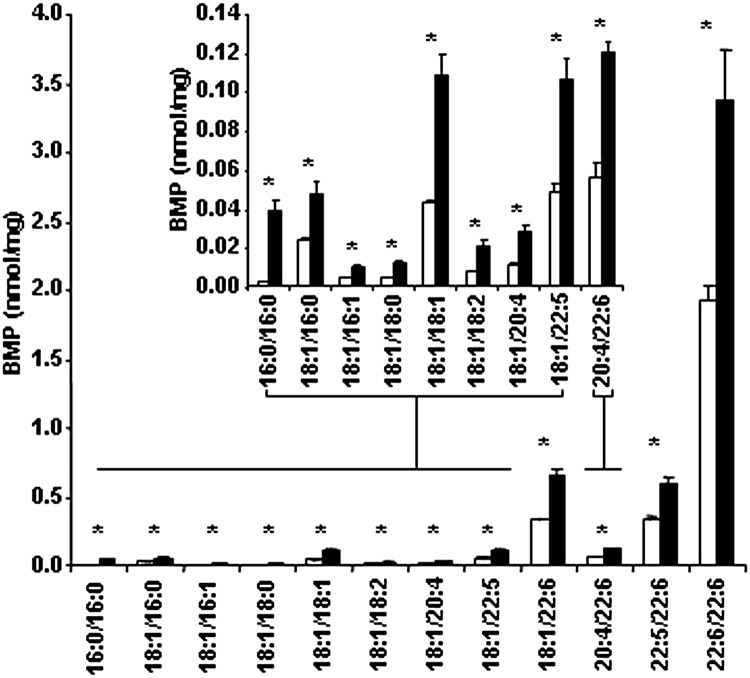
Fig. 1.
BMP in the Gaucher THP-1 macrophage model. THP-1 macrophages were grown for 10 days, harvested, and then lipids extracted. Individual BMP species were measured by ESI-MS/MS and are shown in THP-1 macrophages (open bars) and the Gaucher THP-1 macrophage model (solid bars). Results are reported as nanomoles of each individual BMP species per milligram of total cell protein and expressed as the mean and standard deviation (n = 3). *Significant at P < 0.05 (Student t-test).

