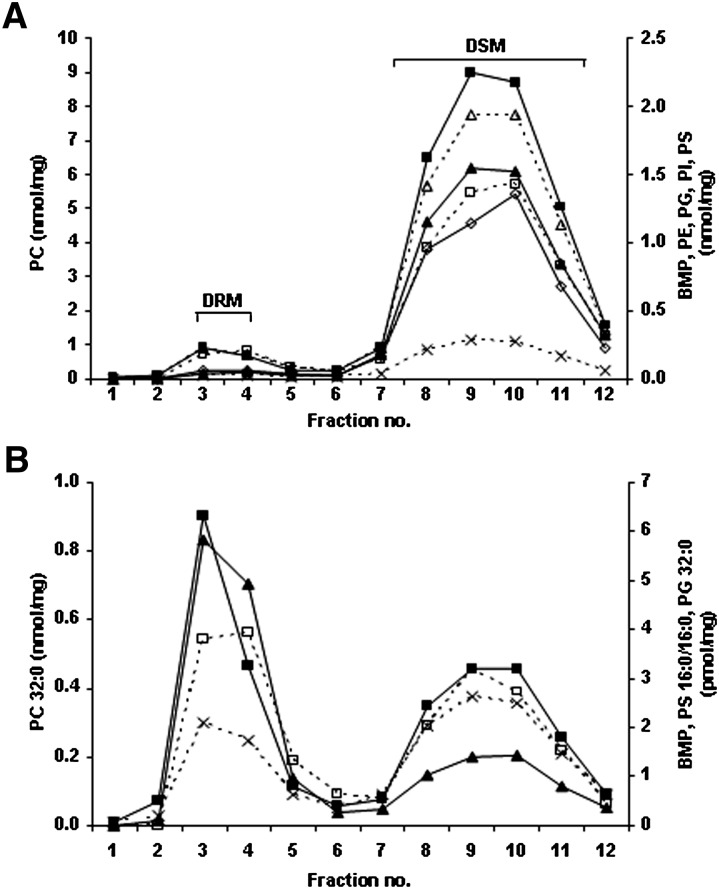
Fig. 2.
BMP and phospholipid distribution in DRMs and DSMs. Lipids in each fraction from the DRM and DSM isolation of the Gaucher THP-1 macrophage model were extracted and measured by ESI-MS/MS. (A) Individual species of BMP (solid triangles) (excluding BMP 16:0/16:0), PC (solid squares) (excluding PC 32:0), PE (open triangles), PG (crosses) (excluding PG 32:0), PI (open diamonds), and PS (open squares) (excluding PS 16:0/16:0) were summed in each of the membrane microdomain fractions to give total amounts. (B) Distribution of the fully saturated species, BMP 16:0/16:0 (solid triangles), PC 32:0 (solid squares), PG 32:0 (crosses), and PS 16:0/16:0 (open squares). Results are expressed as nanomoles or picomole of phospholipid per milligram of total protein loaded onto the gradient prior to fractionation.

