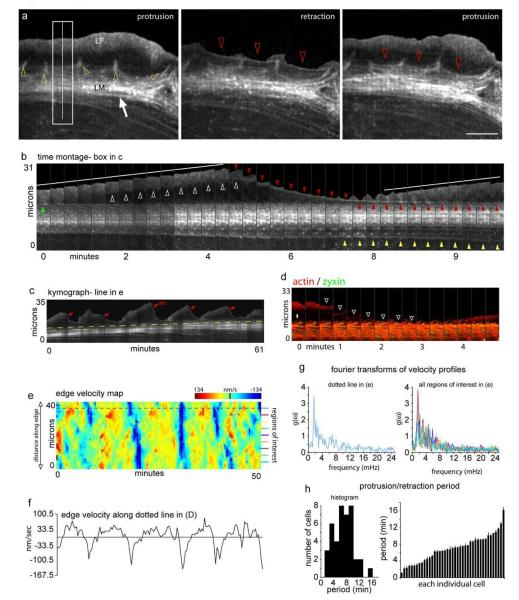
Figure 3.
Actin arc dynamics at the leading edge. a) Three frames of a time-lapse recording of actin-mRFP showing the cytoskeletal organization at the leading edge during the transition from protrusion to retraction and back to protrusion. Star denotes actin network in the lamellipodium and arrow denotes actin arcs in the lamella. Yellow arrowheads show actin filaments associated with focal adhesions. Red arrowheads show a newly forming actin arc. b) Time-lapse montage of the box in (a) showing the formation of an actin arc (red arrowheads) between protrusion events (white lines). Green arrowhead shows the actin arc formed during previous retraction event. Yellow arrowheads show the removal of actin arcs. c) Kymograph of the line in (a) showing multiple protrusion and retraction events over 1 hr. Red arrows denote the first frame an actin arc was observable and yellow dotted line shows lamellar advance. d) Actin-mGFP and zyxin-mCherry montage showing an actin arc can form (white arrowheads) before coming in contact with focal adhesions (yellow arrow). e) Protrusion/retraction map showing edge velocity (shown by color bar) changes over time across the edge of the cell in (a). F) Plot of the edge velocity from the dotted line in (e). g) Fourier transforms of the velocity profiles represented by the colored lines in (e). h) Distribution of the period of the protrusion/retraction cycle among 41 cells. Scale bar, 10 μm. The change in intensity in (b) from frame 10 to 11 is due to focusing.

