Figure 7.
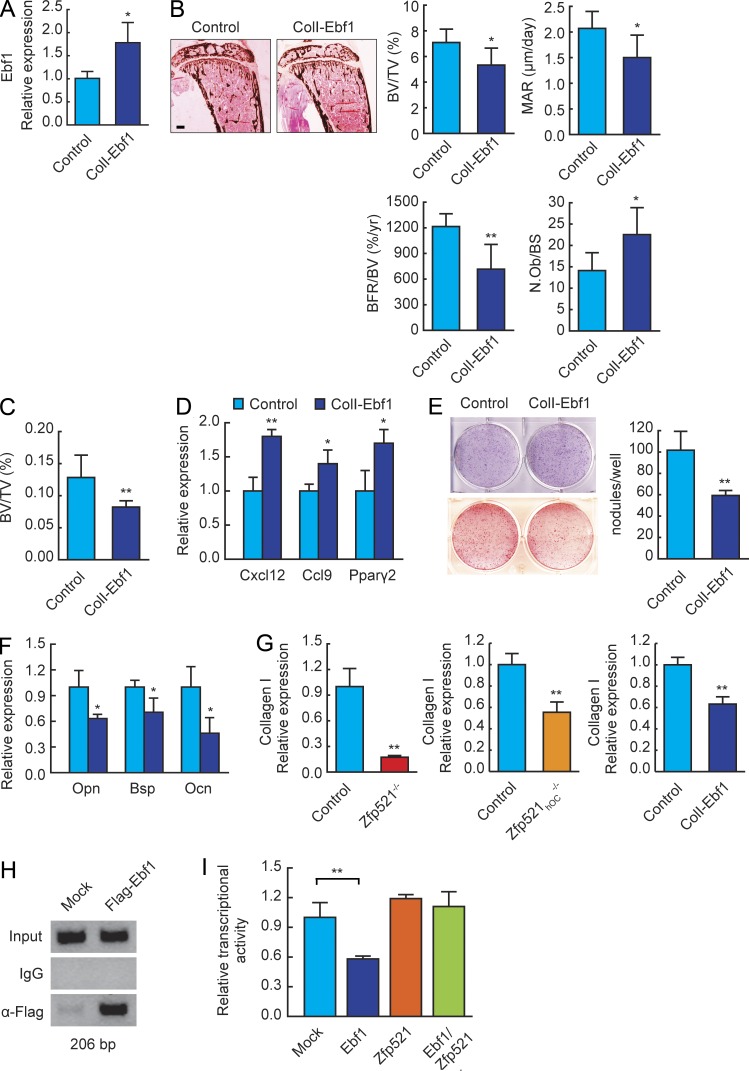
Ebf1 suppresses bone formation in vivo and in vitro. (A) Ebf1 expression in bone RNA from control and ColI2.3-Ebf1 transgenic mice measured by qRT-PCR (n = 6). (B) Von Kossa staining and histomorphometric analysis of tibia sections in 6-wk-old ColI2.3-Ebf1 transgenic and control mice (n = 6). N.Ob, number of OBs. Bar, 600 μm. (C) Metaphyseal trabecular BV (BV/tissue volume [TV]) in distal femurs of 6-wk-old ColI2.3-Ebf1 mice measured by μCT (n = 6). (D) ColI2.3-Ebf1 and control calvarial cells were harvested from newborn mice, plated on 6-well plates, and cultured in OM for 21 d. Expression of Ebf1 target genes was measured by qRT-PCR. (E) ALP (blue) and Alizarin red (red) staining of ColI2.3-Ebf1 and control calvarial cells cultured in OM for 7 d or 21 d, respectively. Bar graph shows quantification of bone nodules in the Alizarin red–stained plates. (F) Expression of OB marker genes Opn, Bsp, and Ocn in ColI2.3-Ebf1 and control calvarial cells after 21 d in OM was measured by qRT-PCR. (G) Col1a1 expression in Zfp521−/−, Zfp521hOC−/−, and ColI2.3-Ebf1 and respective control calvarial cells after 21 d in OM was measured by qRT-PCR. (H) Ebf1-containing chromatin complexes were immunoprecipitated from control and Flag-Ebf1–overexpressing MC3T3-E1 cells using anti-Flag antibody. IgG was used as negative control. The region of the ColI2.3kb promoter containing the putative Ebf1-binding site was amplified by PCR. (I) ColI2.3kb-luc reporter was transfected into C3H10T1/2 cells together with Ebf1, Zfp521, or both. Luciferase activity was normalized to cotransfected Renilla activity. All data are mean ± SD. Similar mRNA and reporter assay data were obtained from at least three experiments performed in triplicate. *, P < 0.05; **, P < 0.01.

