Figure 3.
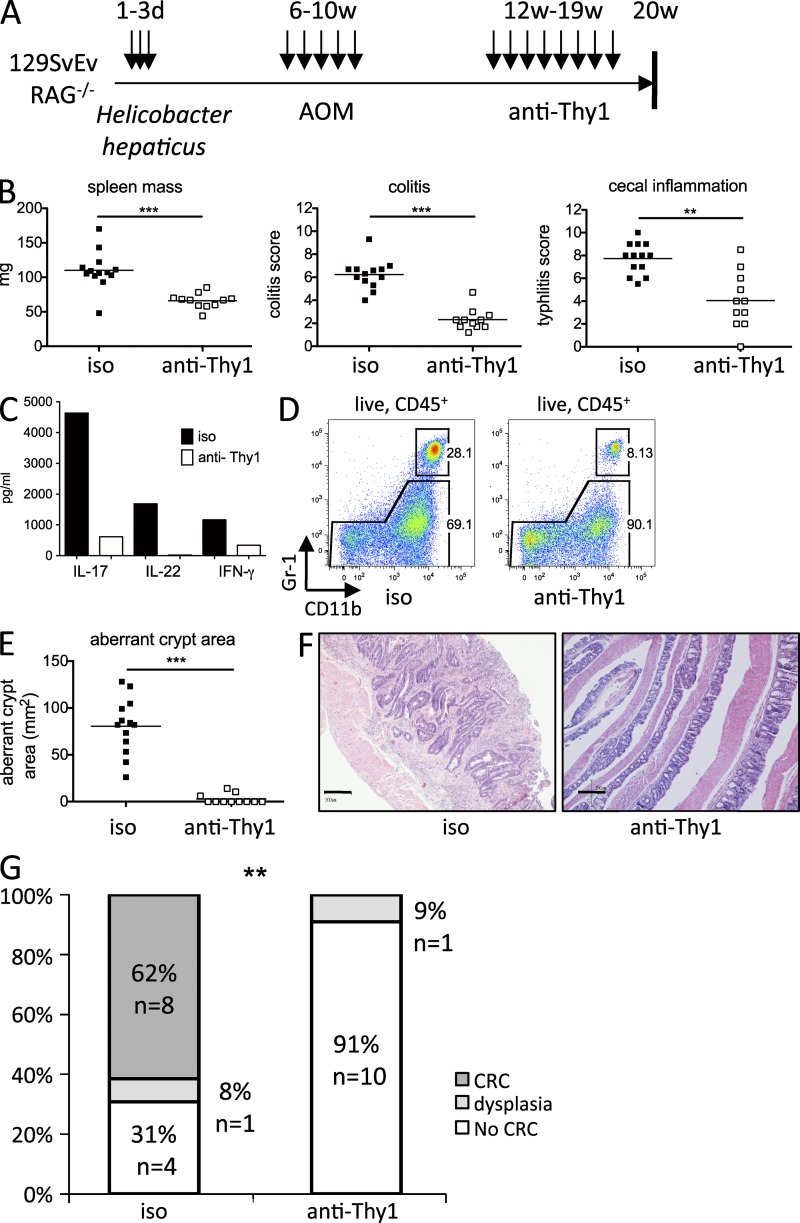
Colitis to cancer transition is dependent on ILC. (A) Treatment scheme. (B) Spleen mass (left), colitis (middle), and typhlitis (right) in isotype (n = 13) or anti-Thy1 (n = 11)–treated Hh+AOM mice. (C) Cytokines in supernatants of pooled cLP cells cultured overnight from one representative experiment of three independently performed experiments. (D) Flow cytometry of colonic CD11bhi Gr1hi granulocytes. (E) Aberrant crypt area on methylene blue–stained colons. (F) Representative photomicrographs (bars, 200 µm) of invasive CRC in an isotype treated mouse (left) and normal colon in an anti-Thy1–treated mouse (right). (G) Highest tumor grade per mouse. Data are shown as means. Results show a pool of two independent experiments (B, E, and G). **, P < 0.01; ***, P < 0.001, Mann-Whitney non parametric t test (B and E), Fisher’s square test (G).

