Figure 3.
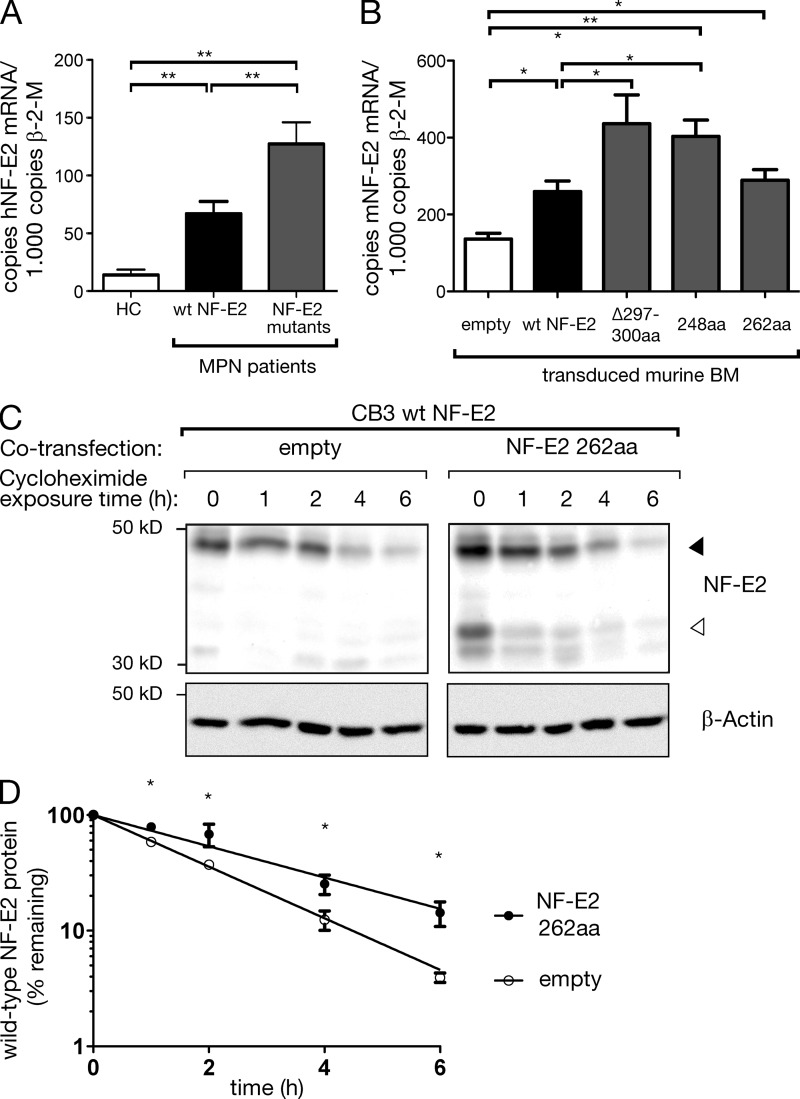
Effect of mutant NF-E2 on WT NF-E2 mRNA levels and on protein stability. (A) RNA was isolated from purified granulocytes of five patients carrying NF-E2 mutations, seven MPN patients with WT NF-E2, and three healthy controls as indicated and subjected to quantitative RT-PCR analysis for human NF-E2 and β-2-microglobulin housekeeping gene expression. A standard curve with known copy numbers of NF-E2 was included on each plate. Sample copy numbers of NF-E2 and β-2-microglobulin were determined from the standard curve and are expressed as relative ratios (copy number NF-E2 per 103 β-2-microglobulin molecules). Mean and SEM are shown. *, P < 0.05; **, P < 0.01 (B) Murine bone marrow of mice expressing the indicated NF-E2 mutants and of control mice was assayed for murine NF-E2 and β-2-microglobulin housekeeping gene expression by qRT-PCR. Results represent the mean ± SEM of four to five animals in each group (n = 2 empty) and are reported as relative ratios (copy number NF-E2 per 103 β-2-microglobulin molecules). Data were analyzed for statistical significance by Student’s t tests. *, P < 0.05; **, P < 0.01. (C and D) CB3 cells expressing WT NF-E2 were cotransfected either with a virus expressing the 262aa NF-E2 truncation mutant or with an empty control virus. Cells were treated with 20 µg/ml cycloheximide to inhibit de novo protein biosynthesis and cell extracts assayed for NF-E2 protein levels by Western blotting for up to 6 h, as indicated. The blot is representative of n = 4 independent experiments. (D) A nonlinear best-fit regression model was used to calculate the half-life of WT NF-E2 protein in the presence or absence of the 262aa truncation mutant. Graphs depict mean and SEM of n = 4 independent experiments. *, P < 0.05.

